Subjective Well-Being between the Migration Experience of Returnees and the Country Effect: An Integrated Approach on European Spaces
-
Author(s):Sandu, DumitruPublished in:Central and Eastern European Migration Review, Vol. , No. online first, 2024, pp. 1-18DOI: 10.54667/ceemr.2024.01Views: 769
How is the well-being of returnees when considered from the point of view of the migration experience abroad? To answer this question, the first hypothesis considers that returnees differ in the function of the key activity they had abroad – working, studying or living there without working or studying. Secondly, even if one maintains constant socio-demographic profiles, the country of return counts. Thirdly, it depends also on the facet of subjective well-being (SWB) that is considered – the happiness of living in a certain country of the European Union or a person’s satisfaction with life, country, public services or income. The results of the multivariate analysis indicate that experience of migration, country of current residence and facets of SWB all count. Returnees – through their experience of migration abroad – are compared to non-migrants. The answers come from analysing data from a large Eurobarometer survey in the European Union. Multivariate regression and cluster analysis are the main data-processing procedures. The stability of the results is tested by sensitivity analysis.
Introduction
The voluntary return of migrants to the place of departure appears to be, in the neoclassical approach to migration (Massey, Arango, Hugo, Kouaouci and Pellegrino 1999), a marker of failure in the individual migration project or the effect of reducing the development gaps between origin and destination (de Haas, Fokkema and Fihri 2015). Those who failed at their destination – or those who found that the gap between the two points of the migration route has since narrowed – return back to the departure communities. The return is theorised completely differently in the new economy of migration, oriented as it is towards migration as a family phenomenon (Massey et al. 1999). This appears to be more of a success – as an accumulation of resources, as planned at departure, to justify the return. In both variants of the approach, the targets of emigration are, mostly, economic gain, social gain (education, family reunification) or cultural (lifestyle, for example). The interpretation is controversial because the simultaneous testing of the two theories is rarely carried out. Consequently, there is a tendency to give credit to both theories, depending on the context, of the initial motivation for migration (de Haas et al. 2015).
Regardless of the nature of the migration targets – goods, values, behaviours, relationships – success or failure translate into dichotomies of subjective well-being (SWB), satisfaction–dissatisfaction, positive–negative feelings and happiness–unhappiness (Gruber and Sand 2022). The state of contentment–dissatisfaction and perceived opportunities can manifest themselves in different spheres of life (income from employment, human capital, personal networks, living environments), in connection with different experiences of migration or residential stability (Sandu, Toth and Tudor 2018). However, subjective well-being variables – structured more cognitively, such as life satisfaction, or affectively, such as happiness – and different positive or negative feelings, all play the role of intermediate variables, of direct influence on different forms of the decision on migration or stability (King and Kuschminder 2022; White 2022).
Usually, analyses of the relationship between migration and SWB are centred on subjective well-being that precedes emigration or that resulting from migration but within the destination country (Hendriks and Bartram 2019). A special case which could be of particular interest to our approach is that of considering the SWB of immigrants compared to non-migrants in the origin country. A good example of such an approach is the research that Gruber and Sand (2022) did on older intra-European immigrants using data from several waves of the Survey of Health, Aging and Retirement in Europe. They compared immigrants with remainers in the country of origin and found that the tendency was for immigrants to have higher levels of SWB compared to those who remained in the home countries.
The form of migration of interest in this analysis is, however, return migration to the place of origin. The research question I am asking relates to the consequences of return migration on subjective well-being in living spaces in the European Union. The topic is very little addressed in the literature on return migration, in which the emphasis is more on the motivations for returning (Bilecen 2022; King 2018; King, Moroşanu, Jakobson, Schmidt, Miah, Vetik and Money 2022; Sandu et al. 2018) or on the skills gained through migration (Croitoru 2020; Hagan and Wassink 2020; Janta, Jephcote, Williams and Li 2021). Here, I am particularly interested in perceiving, in terms of subjective well-being, the country of return as a country of current residence for returning migrants compared to non-migrants. Generally, migration destination studies are much more frequent than those that are focused on migrants’ origin countries. Are returning migrants more satisfied or happier than locals with no experience of migration abroad? Do the different experiences of migration in the former destination country – related to work, education or companionship – have similar or different effects on SWB? What are the effects of return migration on the SWB in the origin countries, after return, if I compare non-migrants with returnees and their different forms of migration abroad, while controlling for place and demographic variables? This is the basic research question which I address. The dominant approach in the literature has dealt with the effects of returning to the origin country, regardless of the returnees’ experience of migration abroad. The generic hypothesis from which I start is that, in fact, the form of migration experience abroad also matters as a specific facet of subjective well-being. The expectation is based on the finding that the different defining variables for SWB, although interrelated, frequently have mutual relations of relative independence (Diener, Oishi and Tay 2018; Ruggeri, Garcia-Garzon, Maguire, Matz and Huppert 2020). In addition, it is expected that, in the return equation, the level of the decision to return also mattered – as did the consequences of the return in the form of migration experience in the host state. It is expected that migrations for work, education, companionship, lifestyle or combinations thereof will have different effects on SWB upon return to the country of origin, depending on the context. The next section covers the somewhat few approaches to the relationship between return migration and SWB before presenting the methodological premises of this research.
The subjective well-being of returnees
The key lines of structuring these approaches are the dichotomies between comparative and non-comparative studies, an interest in SWB per se versus some of its specific components (happiness, satisfaction etc.), considering all types of returnees versus considering only specific segments of them and qualitative versus quantitative studies. Cases of life satisfaction/SWB as a dependent variable – but returnees are not a term of reference in the comparison and the reference is only to natives, stayers and immigrants (Voicu and Vasile 2014) – are not included in this analysis. Here are some examples of approaches where SWB is considered as an outcome of return migration.
Galván et al. (2023) developed a qualitative approach starting from 12 interviews with Mexican returnees from the USA. The returnees were satisfied with their pro-social behaviour of helping their families and friends at home and with the language skills and job experience they acquired abroad. Dissatisfaction was also mentioned in the subjective mix of their perceptions of return. Such findings are a good basis, the authors of this article feel, for questioning the idea that, every time, returning home should be considered a sign of failure.
Multiple comparisons between current migrants abroad, returnees and stayers were developed using data collected in 2010 and 2011 on older people in 5 regions of Turkey (Baykara-Krumme and Platt 2018). It is not known how representative the sample of 1,019 persons might be. Current migrants abroad are experiencing a medium level of life satisfaction that is higher than that of stayers or returnees. Income, health and social networks explain a significant percentage of the differences in life satisfaction among current migrants, returnees and stayers.
Grabowska and Jastrzebowska (2023) analysed the effect of Polish returnees’ migration experience abroad on their informal human capital by comparing stayers and returnees. The variables included job satisfaction, life satisfaction and soft skills in the broader concept of informal human capital. The finding is that the informal human capital of returnees is higher, compared to that of stayers and such a migration resource could be used by organisations. The authors also conclude that informal human capital is equally differentiated by the former destination country. The net effect of the former destination country is not determined by controlling for demographics like age, gender, occupation, education etc. Next, I present the methodological premises for the research and, subsequently, the results and conclusions.
Data and method
The approach with which I start argues that SWB is a self-estimation of one’s own life – from perspectives dominated by knowledge, as in the case of satisfaction with life or by feelings or combinations thereof and as in the case of happiness – on specific spheres of life or as a whole. As in demography, however, I distinguish between events, actions, processes or structures associated with SWB and migration. Using mainly survey data at the European level, I adopt the SWB perspective as a social phenomenon consisting of the aggregation of events of contentment–dissatisfaction or happiness–unhappiness concerning a person’s life, occupation, public services or country of current residence. Such phenomena of subjective well-being can be traced not in their dynamics at the level of the individual but by categories of factors of conditioning of gender, age, education, residential environment, country of residence, skills in using the Internet, way of reporting to the institutions of the national society of countries of residence, the experience of migration abroad, etc.
The multiple comparisons that I make in order to understand the relationship between the subjective well-being of returning migrants and their experiences of migration abroad will be made, starting not from qualitative data (Galván et al. 2023) but from the data from the standard Eurobarometer 89.1 survey, conducted in March 2018 (EB89). Although the Covid-19 pandemic of 2019–2022 that followed very probably changed such relationships, it is important to have a first picture of them before the pandemic.
Concerning the main independent variable of interest, each of the interviewees was asked if s/he had worked, studied or lived abroad. More specifically, the subjects were asked three questions: whether or not they had personally ‘benefited’ from working, from studying or from living in another EU country. The intersection of these responses resulted in a typology with 5 categories (Table 1). Around 72 per cent of those surveyed (15+ years old) did not have any experience of returning from abroad (i.e. from another EU country) to their EU home country. Those who studied and worked abroad and then returned represented about 15 per cent of all interviewees. This is followed, in descending order, by those who had worked abroad (7 per cent), those who had studied abroad (4 per cent) and those who had lived in another country, probably accompanying other migrants in the family (2 per cent).
Table 1. Migration experience abroad and agreement with the statement ‘You are happy living in … country’
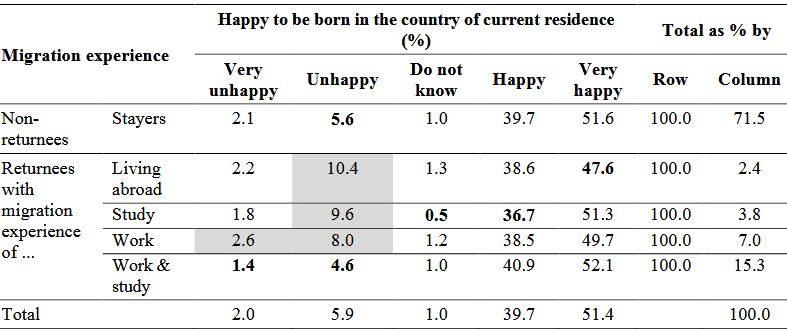
Data source: Eurobarometer 89.1, March 2018 (EB89).
Notes: Shadow cells for a positive association between the row and column values and bold figures for negative associations, as indicated by adjusted standardised residuals (not indicated here), for p<=0.05. Example: 47.6 per cent of the people who lived abroad while accompanying other family members were not very happy with living in the country of return. No category of returnees is significant, happy or very happy with their residence country. N=27,988.
If I intersect these categories of people, identified by their migration experience, with the main categories of people, depending on their happiness about living in their country of current residence, I find that the unhappiness related to the country is specific to those who have returned. If I abstract other demographic characteristics of the interviewees – age, gender, matrimonial situation, education or residence environment – I find that those who are happy with the country in which they live do not seem to be associated with the experience of migration abroad. In other words, in the EU as a whole, those who have returned to the country of origin tend to be rather unhappy. The exception is those who have worked and studied abroad – they do not seem to be unhappy.
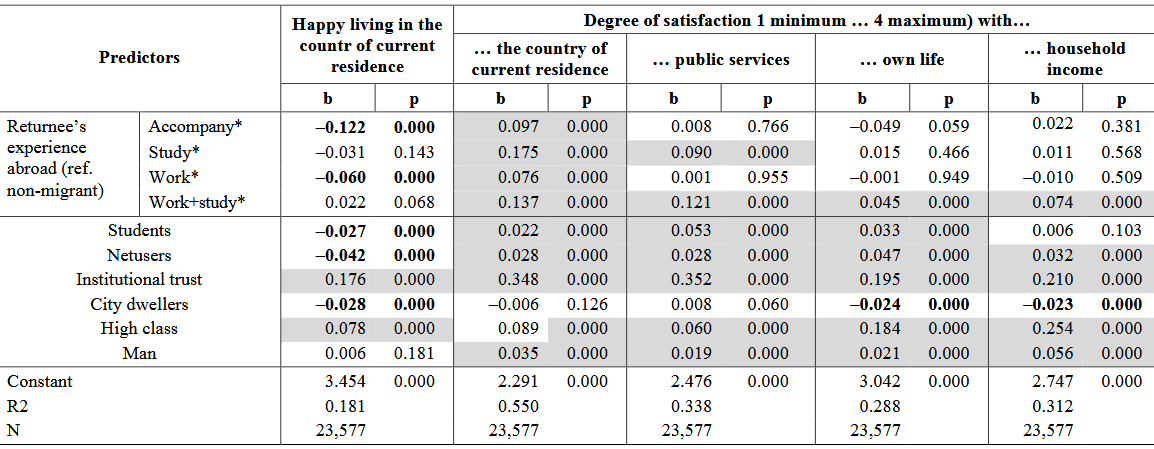
In which countries did returnees live who were predominantly unhappy about the country? If I introduce in the analysis, through multivariate multiple regression (as in Table 2) demographic specifications related to age, gender, education and residential environment, for example, are the relationships in Table 1 maintained? Through such a procedure I am testing whether the bivariate relations of significance from Table 1 are maintained if associated with other predictors of the migration experience. This is also a way to test whether the migration abroad experience is a powerful predictor for subjective well-being even after introducing other control variables.
I measure the subjective well-being of the returnees through indicators related to the perception of the country in which those interviewees lived (happy to live in that host country, satisfaction with the country, satisfaction with public services), to their satisfaction with their own life and with the level of income in the household. All 5 indicators are equally coded, with direct scaling, with a score of 1 for maximum dissatisfaction/unhappiness and 4 for maximum satisfaction/happiness. All 5 SWB indicators are subsumed to the same latent variable in the case of factor analysis (KMO index is 0.75, indicating that about three-quarters of the observed variables are explained by the latent factor). To be able to reconstruct the complex relationships between SWB on the one hand and the environment and life experience of those interviewed, on the other, I opted for maintaining subjective well-being indicators as dependent variables in regression patterns. The option starts from the finding that, although independent, SWB indicators have, in some cases, relatively independent variation (Diener et al. 2018).
To facilitate comparisons between the different facets of SWB, I opted not for 5 multiple regression equations but for a single multivariate regression equation, with 5 dependent variables and 12 predictors (see the syntax of the equation in the footnote to Table 2). The choice of multivariate regression allows for easier computing and multiple comparisons by computing tests for different pairs of coefficients of regression (UCLA n.d.).
Where possible I preferred to encode predictors as nominal-type variables. This is the case for migration experience abroad, education, age groups, categories of localities of current residence and countries of habitation. The option is given in the expectation that there will be non-linear relationships between the predictor and the dependent variables (for specifications related to how to measure the analysis variables, see Table 2). The migration experience abroad, for example, could be encoded dichotomously, noting with 1 the fact of having lived, worked or studied in another country of the European Union or with 0, the lack of migration experiences abroad, in the sense already mentioned above. Instead of such a dichotomous predictor, I preferred to operate with a typology already presented in Table 1. It has been entered as a nominal variable in the equations for predicting SWB variables, considering the category of those with no experience of emigration to other EU countries as a benchmark.
Similarly, I considered the country of current residence at the time of the survey as a nominal variable, with 28 values corresponding to the country of residence in March 2018. After several experiments, to avoid the unwanted phenomenon of interlinkage between independent variables (multi-colinearity), I considered as a reference value the fact of living either in France or in one of the four smaller EU countries for which the sub-samples were very small (Malta, Republic of Cyprus, Luxembourg and Estonia).
Subsequently, after running the regressions with the mentioned variables, I deepened the analysis by identifying the cultural models of the country’s impact on SWB. I have characterised the SWB impact profile of each of the countries of current residence included in the analysis through a series of 5 values of the regression coefficients estimating the specific impact of each country on the SWB variable and the 5 probabilities associated with the regression coefficients as measures of the observed significance of the coefficients. Subsequently, on the matrix of 23 countries and the 10 columns taken from the regression models, I applied a cluster analysis model. The result was the dendrogram shown in Figure 1. Based on that graphic, I determined the 7 groupings of countries with similar impacts on SWB variables. For the rest of the technical details, see the footnote in Figure 1 in the section on the country effect. To see the specific causal profile for each of the country groupings, I built a new variable through which I replaced the reference country as a predictor with the grouping of countries resulting from the cluster analysis. The results of this new regression analysis allowed us to characterise the cultural specificity of the group in influencing SWB.
The first hypothesis from which I started (H1) claims that SWB, caeteris paribus, tends to be higher for those who have had the double experience of studying and working abroad. The expectation is based on the premise that, at the level of the respective group, the accumulations of possible utility after returning to the country of origin were higher on human, material and cultural capital. With such accumulations, they were able to get more rewards on the comeback, with a direct positive impact on SBW. The reference term in the structuring of H1 was those with no experience abroad.
The second hypothesis (H2) holds that the SWB model, caeteris paribus, tends to be specific to groupings of countries with similar economic development and immigration and located in the territorial vicinity. Status and share capital variables are considered to be control variables and are expected to have differentiated relationships with SWB. To test the stability of the regression and cluster models I worked with, I also adopted the idea of a sensitivity analysis. Based on a factor analysis, I reduced the 14 status variables to 7 (Table A1, in the Appendix). One of the factors with the highest consistency, for example, is given by the group that includes young people of 15–34 years, those still in school and those who are not married. Similarly, another grouping is formed with the two variables relating to institutional trust – namely trust in government and parliament – that goes together with trust in central and local government. Reduced models with fewer socio-demographic variables work in a similar way to extended models in which SWB predictors are dependent on multiple predictors. In the results section I comment on these issues in more detail. Next, I present the effects of the migration experience, the country profile and the status situation on the 5 dependent variables that measure SWB.
The effect of the migration experience abroad
At first glance, the experience of migrating abroad does not affect the migrants’ happiness at living in the country of current residence. In the Eurobarometer survey data, 91 per cent of returnees from other EU countries say they are happy to have been born there. The percentage of happy people, for the same reason, is identical for those who have not lived in other EU countries. The long-term evaluations reflected by the life satisfaction indicator are different. From this point of view, returning migrants tend to be more satisfied (86 per cent), compared to non-migrants (82 per cent satisfied with their own lives).
If I follow the same relationships but introduce multiple control variables (those in Table 2), I find that the fact of having lived abroad in the EU, for whatever reason, is equally unimportant for the state of happiness/unhappiness about the country of residence at the time of the survey. In other words, the experience of migration outside the country of current residence does not matter (the calculation results are not presented here). Returning migrants tend to be more satisfied with their own lives than non-migrants in the multivariate regression analysis, using the control variables in Table 2. It follows from the same type of multivariate analysis that migrants returning to European countries from other EU countries tend to be more satisfied than non-immigrants in terms of satisfaction with the country of current residence, public services and the level of household income.
However, if I introduce into the equation not the simple fact of being or not being a return migrant but a typology that differentiates between different categories of migration experiences abroad (working, studying or living there, without having been employed or studying), how do the effects on SWB occur? As I will see, the picture is very different.
For all 5 forms of SWB considered in the analysis, consistent with H1, a positive effect of having worked and studied abroad was recorded (Table 2). Of course, the effect of the migration experience is noticeable, especially concerning those who have not been abroad at work, for studies or as companions. The prediction pattern, from this point of view, differs, however, depending on the type of subjective well-being. In personal reporting through satisfaction with life or satisfaction with income in a household, migration experiences abroad seem to matter less. The only facet that matters significantly and positively, as I have already mentioned, is that relating to the accumulated experience of working and studying abroad.
Returnees who have worked abroad tend to have conflicting reporting. They seem to be satisfied, in general, with the country in which they live (the home country) but not happy that they were born there. I do not know, from the data I am working with, whether differentiated reporting derives from the difference between satisfaction and happiness or from the fact that happiness is an assessment in which the country of origin is compared to other countries and in the satisfaction assessment that comparison is probably less present. A similar situation is found for those who have been abroad simply to accompany migrants, without employment or study targets. They tend to be satisfied with the country of return but unhappy that they live there. As with the experience of working abroad, the difference in the comparative or non-comparative assessment of the country seems to matter, in the sense that the comparative assessment that I associate, hypothetically, with happiness, seems to be more demanding, while the non-comparative assessment related to satisfaction with the country could be less demanding.
For those who have studied abroad and returned to their country of origin, I only have an effect of increased satisfaction with public services and, in general, with the country of return. Otherwise, the strictly personal effect, on satisfaction with life or household income does not seem to be significant.
Is the configuration of the impact that migration experiences have on SWB maintained also when I move on to the low analysis model in which socio-demographic predictors are reduced by factorial regrouping (compare Table 2 with Table A2, in the Appendix)? In essence, yes. Those unhappy with the country where they live (the home country of residence), in both versions of the calculation, are mainly those who have worked abroad and those who accompanied them, without working or studying. Similarly, those who have worked and studied abroad tend to be satisfied, as a trend, in both variants of calculation. Only 1 difference arises in the explanation of happiness related to the country in which those interviewed live. In the extended model, the effect is significant and positive and in the restricted model the number of predictors is insignificant.
Is there still a country effect if I control, through analysis procedures (multivariate regression), for both the role of the migration experience and that of the socio-demographic status? I try to answer this question in the section that follows.
Table 2. Predictors of happiness and satisfaction in European Union countries, full model
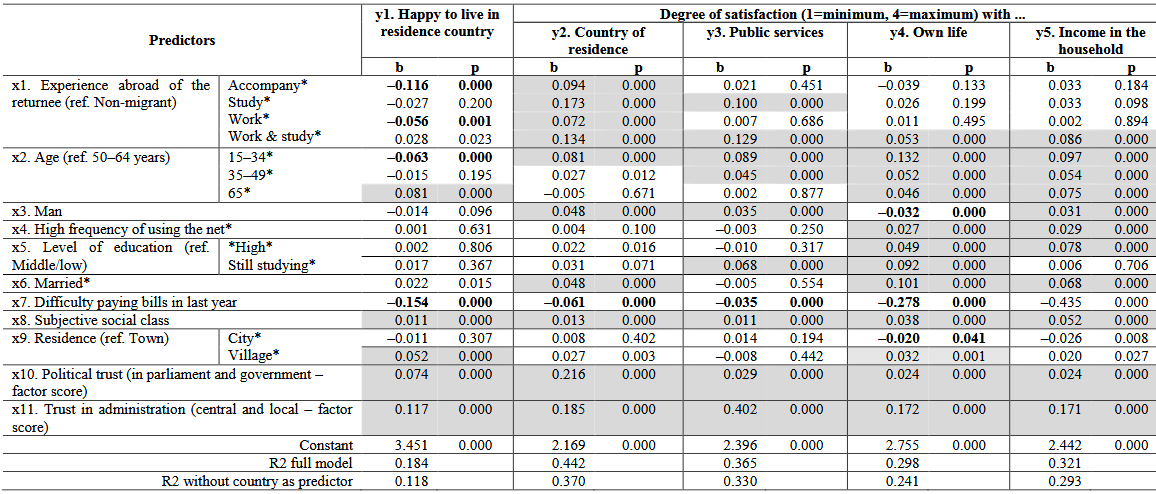
Data source: Eurobarometer 89.1, March 2018 (EB89).
Notes: Results of multivariate multiple regression. b = regression coefficient, p = significance level. Small countries – Cyprus, Malta, Estonia and Luxembourg – are not included. France is also omitted as a reference country, to avoid multicollinearity in tests of the multivariate regression. Coefficients for the 23 countries of residence are not presented here. The sintax for multivariate regression in STATA17 is: mvreg y1 y2 y3 y4 y5= i.x1 i.x2 x3 x4 i.x5 x6 x7 x8 i.x9 x10 x11 i.x12 [aweight=w23]. The significance for dependent and independent variables is given in the table and the letter i marks categorical variables. x12 is for country as categorical variable (see Table 3). w23 is the weighting variable as provided in the public data file of Eurobarometer. Country happiness is tested by a question on the agreement with the statement ‘You are happy living in … (reference country)’. The answers for all the dependent variables are recorded by direct scaling: 1 fully disagree … 4 fully agree, with the positive statement for all the 5 SWB components. * Dummy variable. Shadow marks the positive regression coefficients that are significant for p<=0.001. Negative regression coefficients for p<=0.001 are in bold figures. Shadow and bold are used to make evident the probable relations of maximum intensity. N=23,577. R2 without migration experiences as predictors is slightly lower than for the full model, with .001 or .002. The reference category for migration abroad experience, for example, is the category of non-migrants, as specified in the table. Education and subjective social class could be endogeneous variables, affected by SWB and migration experience abroad, which is why we ran the same model without the referred variables. R2 modifications are very small, only to the third decimal of R2. One can infer by this sensitivity analysis that the model is quite stable, not so much affected by small changes in the equation. Practically, the coefficients in the regression models without education and subjective social class keep the same significance pattern as in the models presented in Table 2. This is clear proof of the fact that the results of this analysis are not modified by slight methodological changes. The statistical experiment proves, also, the fact that the models are not affected by endogeneity.
Country effect
The country of current residence counts, differentiated in intensity and meaning, in influencing the SWB, whether they are considered independent EU countries or groupings. This is the first analysis in the field when the country’s impact on SWB is no longer determined by averages of subjective welfare indicators but by the net or specific effect of these countries at the level of a multivariate regression analysis. In other words, the classification or grouping of countries is carried out in terms of their specific impact on SWB and not by calculating averages of dependent variables at the country level.
I introduce each of the groupings of countries and their specific prediction profile in Table 3. The groupings of countries are structured, to a large extent, according to the H2 hypothesis. Immigration countries appear in the first two groups, at the top of the graph in Figure 1.
Figure 1. Similarities between countries by their specific impact on the 5 items of subjective well-being, starting from full model regressions
Data source: Eurobarometer 89.1, March 2018 (EB89).
Notes: Results of hierarchical cluster analysis, furthest neighbour, correlation coefficients as measures of similarity, standardisation of clustering variables by z scores. Input data come from the 5-regression equation presented in Table 2. The causal profile for each of the 23 considered countries is given by the regression coefficients predicting the values of the 5 SWB indicators in the multivariate regression, with the 18 predictors that are specified in Table 2, plus the 23 residence countries from the EU (reference term – four small countries and France) and also the significance probabilities for each of the dependent variables for the SWB indicators. Example: the highest similarity of causal profiles in influencing SWB at the country level is for samples from the Southern-European countries of Croatia, Spain, Italy and Greece. The most heterogeneous cluster includes Romania, Portugal, Slovakia and Bulgaria. The last two statements are based on the mean values of Silhouette coefficients that were computed for each country and cluster. The mean value for the Silhouette coefficients is 0.421. The closer this value is to 1, the more homogeneous the country clusters.
Table 3. Country impact on subjective well-being, keeping under control other factors
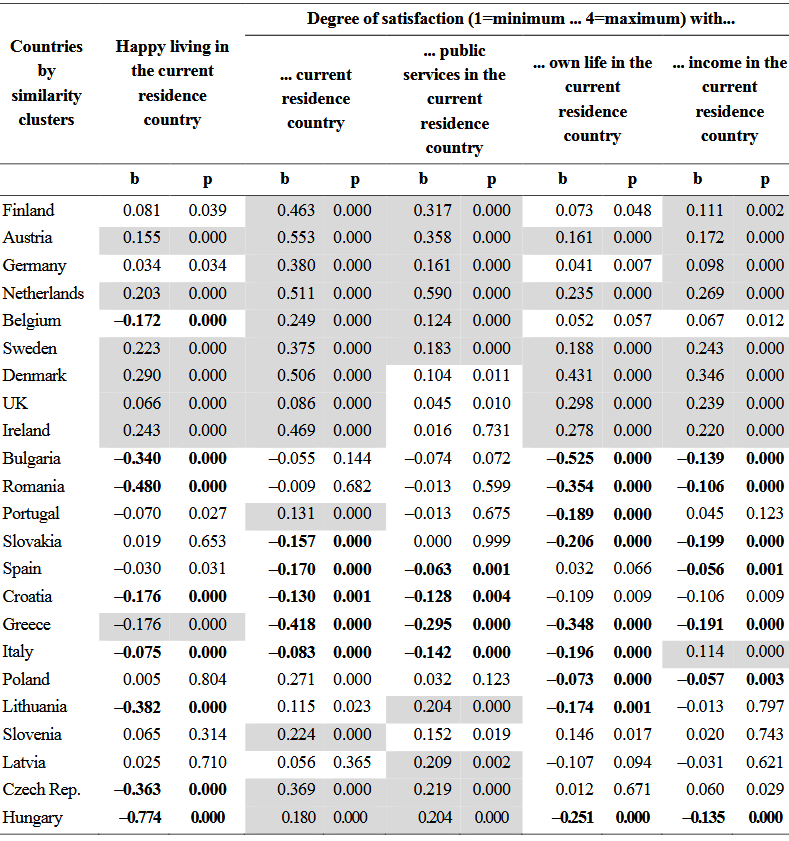
Data source: Eurobarometer 89.1, March 2018 (EB89).
Notes: Results of multivariate multiple regression using, also, the predictors from Table 2.b regression coefficient, p significance level. Shadow marks the positive regression coefficients that are significant for p<=0.001. Negative regression coefficients for p<=0.001 are in bold figures. Shadow and bold are used to make evident the probable relations of maximum intensity. Reference values for the country – France, Luxembourg, Cyprus, Malta, Estonia.
I found that the grouping of the Nordic countries (Sweden, Finland, Denmark, Great Britain, the Netherlands), plus Austria, is characterised by generalised satisfaction on all 4 indicators of satisfaction and by declared happiness about living in the country of current residence. The only exception within the grouping is Belgium for which there are positive effects on satisfaction but negative on the happiness of living there. Why this exception? Additional data are needed for elucidation, which is not available in the survey to which I refer. I also note that the nucleus of maximum causal similarity within this grouping is given by Germany, Austria and Finland (see the graph in Figure 1). Each of the component countries of the group has at least 1 neighbouring country in the class of belonging, as expected, based on the formula in H2.
Close in the causal profile is the grouping of the Nordic countries – Sweden, Denmark, Great Britain and Ireland. It is also specific to them to record positive, statistically significant effects on subjective well-being, as measured in this case. One exception was Ireland, where there is no positive country effect on satisfaction with the quality of public services. The nucleus of similarity of the group consists of the two Scandinavian countries of Sweden and Denmark. Both groups discussed so far are made up of relatively developed countries capable of attracting migrants (H2).
At the opposite pole are countries from the East of the EU (Bulgaria, Romania, Slovakia) plus 1 country from the south of the EU – Portugal. All four of these countries are characterised by their negative impact on life satisfaction. In addition, living in 3 of them – Romania, Bulgaria and Portugal – also has a significant negative impact on happiness related to the country in which the interviewees live. All are countries of emigration.
The countries of Southern Europe – Spain, Croatia, Greece and Italy – are specific to the fact that housing at their level brings, predominantly and significantly, dissatisfaction with public services and the country of current residence. As in previous groupings, one exception appears – Greece. Like the other Southern countries, Greece is marked by negative effects on subjective well-being but not on the happiness of living there. On the contrary, caeteris paribus, living in Greece, despite dissatisfaction with life, public services, income or country, is accompanied by the happiness of being born in the environment of that country. It captures the simultaneity of dissatisfaction with the country in contrast to the happiness of living in that country. Why so? As usual, I say that more data are needed to respond. Hypothetically, I can assume that a significant role in this complexity of relations is also played by the climate, the advantages of a country of tourist attraction, etc. I note that the maximum similarity in the group is recorded between Spain and Croatia.
Two of the Central and Eastern European countries – Hungary and the Czech Republic – appear separately in a grouping characterised, essentially, by the positive impact that residency in these countries has on satisfaction with the country and with the quality of public services. Despite these positive effects on satisfaction indicators, residency in the two countries contributes to registering a situation of unhappiness with the country of current residence. Lithuania, Latvia and Slovenia appear in a separate grouping characterised more by the heterogeneity of influences on SWB or by an insignificant impact on different aspects of well-being. Poland appears as a singular country with a weak causal profile. Only dissatisfaction with a person’s own life and household income seems to define the impact of residency in this country on SWB.
How stable is this grouping of countries, because of the relationships between predictors and subjective wealth variables? To answer the question, I resumed the cluster analysis starting from the data of the reduced regression model in which I replaced the 14 socio-demographic variables with the factors that regroup them (Table A1, in the Appendix), keeping the other predictors. The expectation is that similarity relations between very similar country profiles will be maintained (the resulting dendrogram in the new calculation is shown in the Appendix, Figure A1). Austria and Germany, for example, remain strongly similar in terms of the impact that housing in those countries has on SWB variables. Such a finding is all the more credible as the two countries are neighbours and have strong cultural similarities. The same is maintained, in both variants of calculation, for the strong similarities of causal profile between the two Scandinavian countries of Denmark and Sweden.
In the category of countries of emigration, a very strong similarity of causal profile between Bulgaria and Romania is maintained. The basis of this stability of similarity is given by the neighbourhood of the two countries of emigration and also by their proximity from the perspective of their low level of development or quality of life. The Southern countries – Italy, Spain, Greece and Croatia – remain strongly similar in the variant where the input data in the cluster analysis are derived from multiple regression models with a low number of predictors.
The similarity of impact on SWB occurring between the Czech Republic and Belgium is surprising. The two countries are not neighbours and have different migration experiences. Why so? I do not know. In the dendrogram in Figure 1, the Czech Republic appears, naturally, together with Hungary and Belgium, in the proximity of the similarity of some neighbouring countries of immigration (the Netherlands, Germany, Austria and Finland). Poland appears as a single case in Figure 1 and in Figure A1 about the maximum similarity with Slovakia and Latvia. This latter grouping can be more easily explained by the territorial proximity and closer development profiles of the countries in the cluster. On the whole, the two groupings, starting from the regressions with a large number of predictors (complete models) and those derived from regression equations on reduced models, are consistent. As I have pointed out in this last paragraph, grouping differences also occur between the two cluster analyses. Unfortunately, the survey data I work with do not provide essential information for SWB, namely that of personal happiness. When these and similar data can be added to the set of indicators with which I have worked, the previous interrogations will be able to be clarified.
Beyond the migration experiences and the country of residence effect mentioned in the previous sections, SWB is also under the influence of socio-demographic status effects such as those related to age, gender, education, residential environment, marital status, internet use, subjective social class or institutional social capital. In the present analysis, they have the role of control variables, meant to highlight the specific contribution of the variables of interest – the migration experience and the country of current residence in the SWB variation. A brief overview of the effect of these control variables is given in the section that follows.
Status effect
The status variables mentioned act on the SWB independently (Table 2) and in the interaction (Table A2). I shall refer, briefly, to both points. Young people of 15–24 years old tend to be more satisfied, compared to adults aged 50–64, compared to their own life, the income they have in the household, the public services in the country where they live and also the country of current residence. However, they still tend to be more fearless than they are in their country of current residence, regardless of the migration experience they have. This is probably the case, within the EU, because the happiness assessment is constructed, more than that of satisfaction, by multiple references to the situations in other countries. The actual or virtual trips they make abroad help them to see what it is like with social organisations in other countries. The age effect goes together with that of the life cycle. Young people between 15–24 years old tend to be unmarried and still in school or college (Table A1, in the Appendix). It is this effect of interaction between being young, at school and unmarried that provides more degrees of freedom and higher aspiration levels which, in turn, lead to a more critical attitude about the country of current residence, to relative unhappiness about living in the country where they were born, whether or not they had lived abroad. On the other hand, the fact of being unmarried and, to a large extent, reliant on the maintenance of their parents, favours the tendency to be satisfied with life, public services and the country in which they live.
Those who use the Internet more tend to be mostly young or mature, with an SWB profile similar to that of single young people (Table A2). They differ only in that they are inclined to be satisfied with the level of income in the household.
Another composite factor that matters in the equation is also belonging to a higher social class. These, as the data with which I have worked say, are tendential, of course – those who do not have difficulty paying their monthly bills, have a high level of education and recognise themselves as members of an upper social class. The interaction between all these variables leads to SWB, both on satisfaction and happiness indicators (Table A2). Only trust in institutions – government, parliament, central administration and local government – has a similar positive effect on all forms of SWB analysed here.
In terms of the residential environment, SWB seems to be higher in the village than in the big cities. About public services alone, I do not have, at the European level, a significant relationship between the type of residential environment and the SWB. In terms of gender, men seem to be more satisfied than women with income, public services and their own country. Satisfaction with one’s own life seems to be higher in women than in men (Table 2), in concordance. It is unclear why, in the low prediction model, with latent variables as factors, the gender of men seems to be more satisfied. Probably because the gender effect resulting from the factorial analysis (Table A1, in the Appendix) appears to be a composite one, with many other associated variables.
Higher income is reflected in the ability to pay monthly bills. Income, as reflected in the difficulties to pay bills is one of the most efficient predictors of the model (Table 2). All 5 types of SWB are significantly higher if the person did not have difficulties paying bills in the previous year. Multivariate regression allows us to identify the hierarchy of influence of income between different forms of SWB. If one changes the situation from not having to having difficulties paying bills, this reduces happiness in the country by 0.154 units (Table 2). The same type of change reduces, also significantly, the country satisfaction by 0.061 units (Table 2). These are the two regression coefficients. Using a post-command in STATA, after running multivariate regression, allows us to conclude that the impact of income is higher on country happiness than on country satisfaction. Why is it so? I do not have the necessary data to answer the question but I have the empirical reasons to support the hypothesis that income difficulties have a higher impact on country happiness than on country satisfaction.
Conclusions and discussion
This analysis primarily attempts to substantiate the idea that the experience of migration abroad matters to subjective well-being (SWB) differentiated, depending on its content, within the living area of the EU. Specifically, I expect those who have returned to their home countries, with a richer experience of work and study, to be happier with their own country of residence and more satisfied with their own lives. In other words, to have higher subjective well-being than non-migrants from the country of origin to which they returned. Secondly, apart from migration abroad and ordinary socio-demographic factors, I expect the country of current residence effect to also matter. I use the Eurobarometer survey data to support both hypotheses of the research but also bring surprises in terms of knowledge.
The focus of the analysis is, according to the starting assumptions, on the specific or net effects that the experience of migration abroad and the country of current residence have on the SWB. How returning migrants from the EU relate to their well-being is strongly differentiated not only according to their experience of migration abroad but also to the subjective wealth facet being taken into account. Having worked and studied abroad (within the EU area to which the survey refers) brings, caeteris paribus, more satisfaction with personal life, household income and public services in the country where they live if I compare them with non-migrants. The same cumulative migration experience does not lead to a significant, positive effect on happiness in the country of habitation (Table A2, in the Appendix).
If the survey respondent worked abroad but did not study there, then the effects are contradictory: s/he tends to be satisfied with the country in which s/he lives but is relatively unfortunate that s/he lives in the reference country. Subjective well-being related to public services, one’s own life or the perception of household income does not seem to be significantly influenced by his/her experience of migrating abroad.
Why this differentiation of the effects of migration experiences on SWB? It turns out that different facets of perceived well-being are impacted on by different facets of migration. The assessment of the state of happiness–unhappiness is made through multiple, comparative, short-term reports between the former country of emigration and the one of return. In contrast, satisfaction assessments are less comparative and lengthy, mostly centred on the country where one lives. Hence the tendency to show, especially, unhappiness about the home country of residence if compared to the previous destination of migration. In contrast, in non-comparative assessments, related to the country of current residence and the public services in that country, the effect of migration is mainly that of contentment. In addition, it could also be that happiness-centred assessments are short-term and those relating to satisfaction aim at an extended time horizon (Helliwell and Putnam 2004).
Regardless, however, of the effects of migration and those of the socio-demographic characteristics of the respondents – controlled by multivariate regression analysis – the country of current residence also matters consistently. On this feature, the H2 hypothesis is fully confirmed. In developed countries, immigration, like countries of residence, tends to induce increased levels of subjective well-being. Austria and the Netherlands are representatives of this point of view. They are joined by Germany, the Scandinavian countries, Great Britain and Ireland. It is not clear whether the exceptional case is of living in Belgium, with negative effects on SWB.
The predominantly negative reporting to SWB is recorded in the Southern and Central and Eastern European countries.
Regression analyses have failed to identify country-specific effects for each of the 5 subjective welfare variables, controlling migration experiences and socio-demographic aspects. Based on these data, I have identified 7 groups of countries in terms of the similarity of the causal effects that housing within them has on SWB.
The stability of the multivariate analysis results was verified using a factorial analysis of the 14 socio-demographic variables. The 7 resulting factorial scores replaced the initial values of socio-demographic variables in alternative regression models. Starting from the regressions with fewer predictors, I have also generated new clusters of countries in terms of their SWB prediction profiles. The differences that occur in the results are secondary and confirm the reduced sensitivity of the analysis models (Treiman 2014) to the methodological changes made.
The fact that I did not have a direct measurement of personal happiness at the level of the available survey data is an example of a limit, a critical point, in the analysis presented. A more detailed measurement of SWB can, of course, influence the results of the analysis.
Unfortunately, the EB89 does not provide information on the former destination country of returnees, so I could not measure the distance in terms of GDP per capita between the former destination and the current residence country.
Eurobarometer data, used here, were collected before the Covid-19 pandemic. A replication of the analysis, after the pandemic, would undoubtedly be extremely useful.
Acknowledgements
Thanks for the comments and suggestions of reviewers and journal editors on the manuscript. These helped me to improve the analysis. Naturally, I am responsible for the final form of the text.
Conflict of interest statement
No conflict of interest was reported by the author.
ORCID ID
Dumitru Sandu  https://orcid.org/0000-0001-8618-2252
References
Baykara-Krumme H., Platt L. (2018). Life Satisfaction of Migrants, Stayers and Returnees: Reaping the Fruits of Migration in Old Age? Ageing & Society 38(4): 721–745.
Bilecen T. (2022). To Stay or to Return? A Review on Return Migration Literature. Migration Letters 19(4): 367–385.
Croitoru A. (2020). Great Expectations: A Regional Study of Entrepreneurship among Romanian Return Migrants. Sage Open 10(2): 2158244020921149.
De Haas H., Fokkema T., Fihri M.F. (2015). Return Migration as Failure or Success? Journal of International Migration and Integration 16(2): 415–429.
Diener E., Oishi S., Tay L. (2018). Advances in Subjective Well-Being Research. Nature Human Behaviour 2(4): 253–260.
Galván Reyes J., Casanova Rodas L., Saavedra Solano N., Alanís Navarro S., Berenzon Gorn S. (2023). Subjective Well-Being in Mexican Return Migrants. Journal of International Migration and Integration 24: 1067–1089.
Grabowska I., Jastrzebowska A. (2023). Migration Informal Human Capital of Returnees to Central Europe: A New Resource for Organisations. Central European Management Journal 31(1): 14–29.
Gruber S., Sand G. (2022). Does Migration Pay Off in Later Life? Income and Subjective Well-Being of Older Migrants in Europe. Social Indicators Research 160(2–3): 969–988.
Hagan J.M., Wassink J.T. (2020). Return Migration Around the World: An Integrated Agenda for Future Research. Annual Review of Sociology 46(1): 533–552.
Helliwell J.F., Putnam R.D. (2004). The Social Context of Well-Being. Philosophical Transactions of the Royal Society of London. Series B: Biological Sciences 359(1449): 1435–1446.
Hendriks M., Bartram D. (2019). Bringing Happiness into the Study of Migration and Its Consequences: What, Why, and How? Journal of Immigrant & Refugee Studies 17(3): 279–298.
Janta H., Jephcote C., Williams A.M., Li G. (2021). Returned Migrants’ Acquisition of Competencies: The Contingencies of Space and Time. Journal of Ethnic and Migration Studies 47(8): 1740–1757.
King R. (2018). Theorising New European Youth Mobilities. Population, Space and Place 24(1): e2117.
King R., Kuschminder K. (eds) (2022). Handbook of Return Migration. Cheltenham: Edward Elgar.
King R., Moroşanu L., Jakobson M.L., Schmidt G., Miah M.F., Vetik R., Money J. (2022). Editorial Introduction: Relocating East–West Migration and (Im)Mobilities. Central and Eastern European Migration Review 11(2): 5–15.
Massey D.S., Arango J., Hugo G., Kouaouci A., Pellegrino A. (1999). Worlds in Motion: Understanding International Migration at the End of the Millennium. Oxford: Clarendon Press.
Ruggeri K., Garcia-Garzon E., Maguire Á., Matz S., Huppert F.A. (2020). Well-Being Is More than Happiness and Life Satisfaction: A Multidimensional Analysis of 21 Countries. Health and Quality of Life Outcomes 18(1): 1–16.
Sandu D., Toth G., Tudor E. (2018). The Nexus of Motivation–Experience in the Migration Process of Young Romanians. Population, Space and Place 24(1): e2114.
Treiman D.J. (2014). Quantitative Data Analysis: Doing Social Research to Test Ideas. Chichester: John Wiley & Sons.
UCLA (nd). Multivariate Regression Analysis. Stata Data Analysis Examples. Statistical Methods and Data Analytics. https://stats.oarc.ucla.edu/stata/dae/multivariate-regression-analysis/ (accessed 19 February 2024).
Voicu B., Vasile M. (2014). Do ‘Cultures of Life Satisfaction’ Travel? Current Sociology 62(1): 81–99.
White, A. (2022). Return Migration Experiences: The Case of Central and Eastern Europe, in: R. King, K. Kuschminder (eds), Handbook of Return Migration, pp. 299–312. Cheltenham: Edward Elgar Publishing.
Appendix
Table A1. The structuring of the status variables by factors
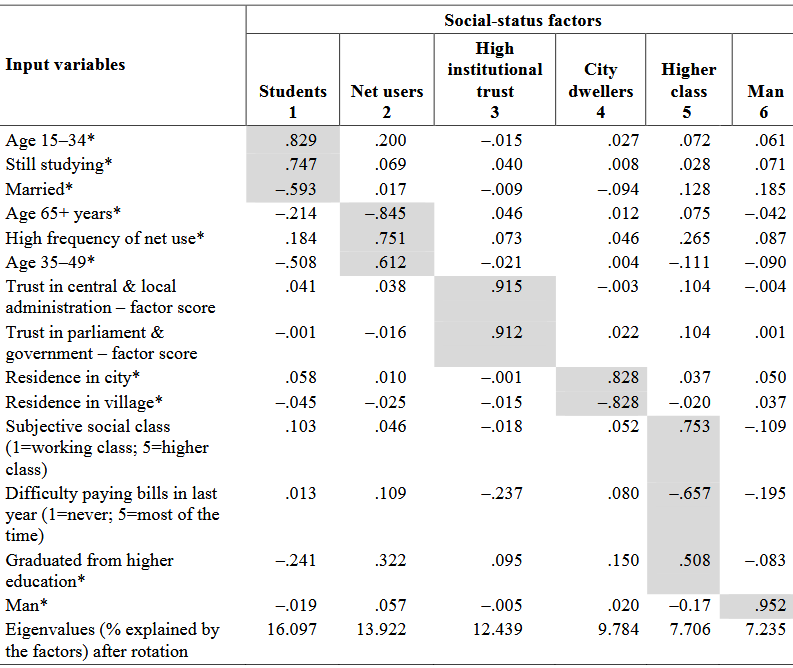
Data source: Eurobarometer 89.1, March 2018 (EB89).
Notes: Extraction Method Principal Component Analysis. Rotation Method: Varimax with Kaiser Normalisation. * Dummy variable. N=23,614. Figures in the table, except the last row of Eigenvalues, are factor loadings. KMO=0.574.
Table A2. Predictors of happiness and satisfaction in European Union countries: reduced model
Data source: Eurobarometer 89.1, March 2018 (EB89).
Notes: Results of multivariate multiple regression: b regression coefficient, p significance level. The socio-demographic variables from Table 2 are replaced by factor scores that are generated by the factor analysis from Table A1. Small countries like Cyprus, Malta, Estonia and Slovenia are not included. France is also omitted as a reference country to avoid multicollinearity in tests of the multivariate regression. Coefficients for the 23 countries of residence are not presented here. Country happiness is tested by a question on the agreement with the statement ‘You are happy living in … (reference country)’. The answers for all the dependent variables are recorded by direct scaling: 1=fully disagree … 4=fully agree, with the positive statement for all 5 SWB components. * Dummy variable. Shadow marks the positive regression coefficients that are significant for p<=0.001. Negative regression coefficients for p<=0.001 are in bold figures. Shadow and bold are used to make evident the probable relations of maximum intensity.
Figure A1. Similarities between countries by their specific impact on the 5 items of subjective well-being, starting from reduced model regressions
Data source: Eurobarometer 89.1, March 2018 (EB89).
Notes: Results of hierarchical cluster analysis, furthest neighbour, correlation coefficients as measures of similarity, standardisation of clustering variables by z scores. Input data come from the 5-regression equation, reduced model, presented in Table A2. The causal profile for each of the 23 considered countries is given by the regression coefficients predicting the values of the 5 SWB indicators in the multivariate regression, with the 10 predictors that are specified in Table A2, plus the 23 residence countries from the EU (reference term – four small countries and France) and also the significance probabilities for each of the dependent variables for the SWB indicators. Example: the highest similarity of causal profiles in influencing SWB at the country level is for samples from the Southern European countries of Croatia, Spain, Italy and Greece. The most heterogeneous cluster includes Romania, Portugal, Slovakia and Bulgaria. The last 2 statements are based on the mean values of Silhouette coefficients that were computed for each country. The mean value for the Silhouette coefficients is 0.559, a bit higher than for the classification using as input data the full models of regression (Figure 1).
Copyright information
© The Author(s)
Open Access
This article is distributed under the terms of the Creative Commons Attribution 4.0 International License (http://creativecommons.org/licenses/by/4.0/), which permits unrestricted use, distribution, and reproduction in any medium, provided you give appropriate credit to the original author(s) and the source, provide a link to the Creative Commons license, and indicate if changes were made.
 Adaptation of the CEEMR website – modernisation and update of the content – for application for indexation in international publications databases, in particular Scopus and DOAJ, as well as proofreading of articles in English are financed from the funds of the Ministry of Science and Higher Education allocated for the dissemination of science under the agreement 765/P-DUN/2016.