A Decade of Membership: Hungarian Post-Accession Mobility to the United Kingdom
-
Author(s):Moreh, ChrisPublished in:Central and Eastern European Migration Review, Vol. 3, No. 2, 2014, pp. 79-104Views: 29724
This paper examines Hungarian migration to the United Kingdom following EU accession. Migration from Hungary has generally been low both before and after accession, but trends have recently started to change. Based on the available statistical data, the paper explores the volume, key demographics and geographical distribution of this migration, and shows how a combination of economic, political and social factors is accountable for the migration of Hungarians to the United Kingdom. To give a human face to the phenomenon, the paper also builds on narrative interviews collected during recent ethnographic fieldwork in London, highlighting the role of economic decline, policy miscalculations, language competence and the online migration industry in shaping the motivations, aims and accommodation of migrants. The paper suggests that migration from Hungary may become more dominant in the second decade of the country’s EU membership than it has been during the first ten years.
Introduction
The 2004 enlargement of the European Union (EU) is often seen as having opened a new chapter in the history of intra-European migration, in terms of both the volume and the forms of movements on the continent (Black 2010; Favell 2008). The ‘novelty’ of this mobility lies, from this perspective, in the special condition of EU membership set against the broader framework of complex interconnections and the articulation of different processes of production and consumption in the globalising world economy (Sassen 1988). Nevertheless, membership conditions are experienced differently throughout the EU, and it is necessary to regularly examine these differences and their evolution. Currently, East–West mobility experiences speak of a phenomenon stranded between ideals of free movement and mutated forms of economic and racial discrimination (Favell, Nebe 2009; Fox, Morosanu, Szilassy 2012; McDowell 2008).
The ‘free movement’ policy is generally seen by EU citizens as best encapsulating the ‘meaning’ of the European Union, as well as being its ‘most positive result’ (cf. European Commission 2013a: 63; European Commission 2013b: 18). In the old member-states, however, this general assessment is coupled with fears regarding the immigration effects of the policy and, in 2004, only Ireland, Sweden and the United Kingdom decided not to impose any serious limitations on the flow of workers from accession countries. This decision had created a situation comparable to an experiment that is unprecedented in the history of European migration (Bahna 2008: 845), and which came to a close in 2011, when the optional seven-year moratorium on labour-market access for the 2004 accession countries expired in all member-states.
The present paper looks at the outcomes of this ‘experiment’ by exploring the case of post-accession mobility from Hungary to the United Kingdom. As Hungary has had a relatively low emigration rate compared to other countries in the region – a trend which has recently begun to change, as the data in this paper will demonstrate – it presents a useful case-study for discussing the complexity of migratory processes in the ‘new European migration system’ (Favell 2008), particularly the role of specific national policies in shaping mobility practices. First, I will place the phenomenon within the wider regional context of Central Eastern European mobility, highlighting the similarities and differences in patterns, and presenting the dominant economic push factors in the wake of the financial crisis. Second, relying on available statistical sources, the paper explores the main geographical and demographic dimensions of Hungarian migration to the UK. This analysis aims to outline some of the possible characteristics of this ‘new’ mobility. The third section of the paper complements the statistical data with qualitative descriptions emerging from recent ethnographic fieldwork in London. For the purposes of the present paper, these descriptions will give a human face to the previously identified trends, and illustrate certain major themes rather than permitting an in-depth analysis.
Post-accession migration in Central Eastern Europe
A decade after enlargement we can form an impression of the outcome of the selective opening of labour markets to new accession countries by looking at the distribution of A12 migrants in EU member-states (see Map 1). As we can see on Map 1, almost 80 per cent of all A12 migrants reside in only four EU15 countries, 23 per cent of them in the United Kingdom.1 This image is radically different from that of 2003, when Germany accommodated 43 per cent of all migrants, and the UK only 8 per cent. Today, in half of the A12 countries (and also in half of the A8), the United Kingdom is the preferred destination for more than a third of all emigrants to the EU15. Germany is still the first, at least in terms of migrant stocks, only in Hungary, the Czech Republic and Slovenia. In the case of Hungary, the importance of previous migration networks is obvious, as there were already 54 714 Hungarian nationals living in Germany in January 2004, and only 6 021 in the UK (Eurostat).
Map 1. Distribution of A12 migrants in EU countries in 2013
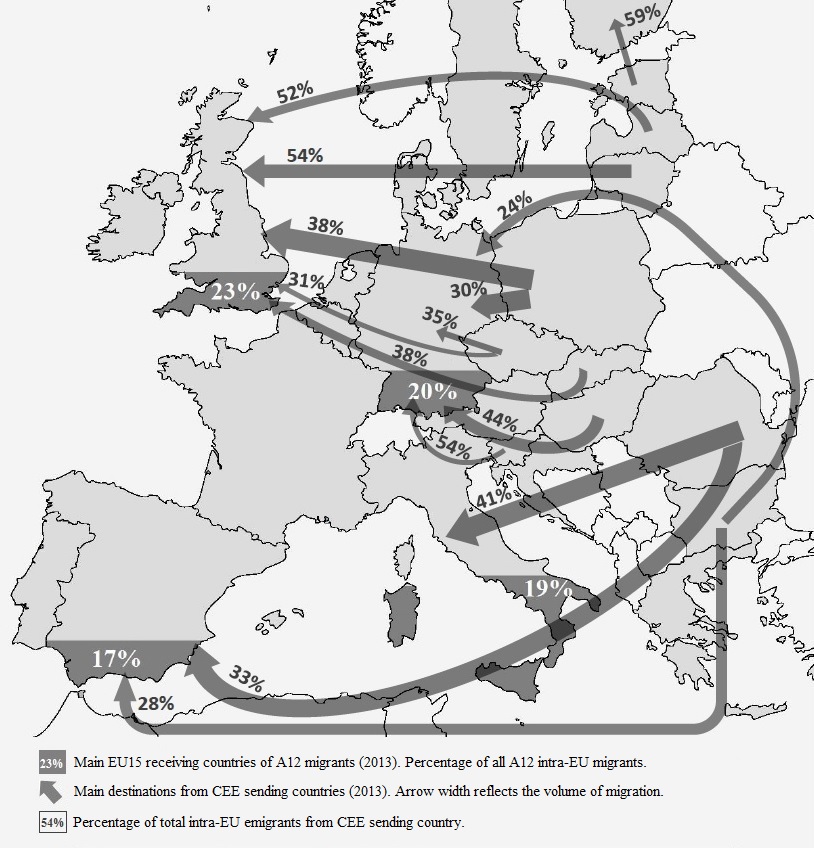
Notes: Data are mainly based on Eurostat [migr_pop1ctz]; missing values have been complemented with the nearest available data from: Eurostat; French census 2008 and 2010 (INSEE 2008, 2011); UK census 2011 (Office for National Statistics; Northern Ireland Statistics and Research Agency; National Records of Scotland); and the Greece census 2011 (El.Stat). Where the difference between the first and second main destination countries was less than 15 per cent, both destinations were included.
Source: own elaboration.
The persisting German orientation in Hungarian, Czech and Slovenian emigration also signals that the ‘social experiment’ created by the unequal distribution of the main pull factor – an open labour market – has had a somewhat different outcome in these three countries, explained by their relatively low emigration rates between 2003 and 2013 (based on the total population in sending countries in 2003): 0.48 per cent for Slovenia, 0.57 for the Czech Republic, and 1.63 for Hungary. Slovakia registered 2.39 per cent, Estonia 3.37 and Poland 3.59, while Latvia (5.33 per cent), Lithuania (6.77 per cent) and Romania (9.07 per cent) reached much higher levels.2 As Bahna (2008) noted when comparing predictions with the actual emigration from accession countries between 2004 and 2006, the Gross Domestic Product (GDP) is highly correlated with migration behaviour, proving the explanatory power of neoclassical theories for intra-European migration. However, if we extend our inquiry up until the present day, these national divergences raise some questions, partly explained by the differential effect of the 2008 economic crisis, which has had a disproportionate influence on emigration from the Baltics.3
The financial crisis and economic push factors in the CEE and Hungary
In contrast to the Baltic States, economic decline in Hungary appears to be a longer-term and steadier trend. As Figure 1 shows, Hungary’s per capita GDP in Purchasing Power Standards (PPS) was still the third highest in the region in 2003, behind Slovenia and the Czech Republic. By 2012, however, Estonia, Lithuania, Poland and Slovakia had all outweighed the Hungarian economy. If we consider the absolute value of earnings in euros, in 2003 Hungary was second to Slovenia alone, while now wages are higher in the Czech Republic, Estonia and Slovakia. This is an important factor in relation to international migration, as the value of remittances depends more on wage differentials in absolute terms and, from a rational-choice perspective, it is this comparison that could influence migration decision-making.
Figure 1. Change in GDP and net annual earnings in 2003–2012
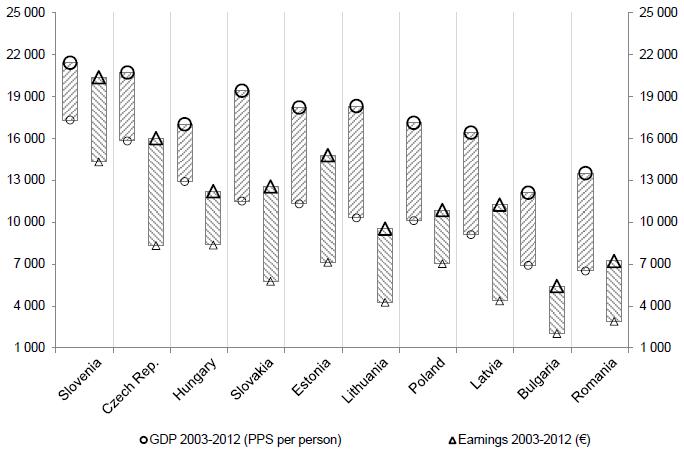
Source: own elaboration based on Eurostat data.
Figure 2. Post-accession CEE emigration rates and GDP
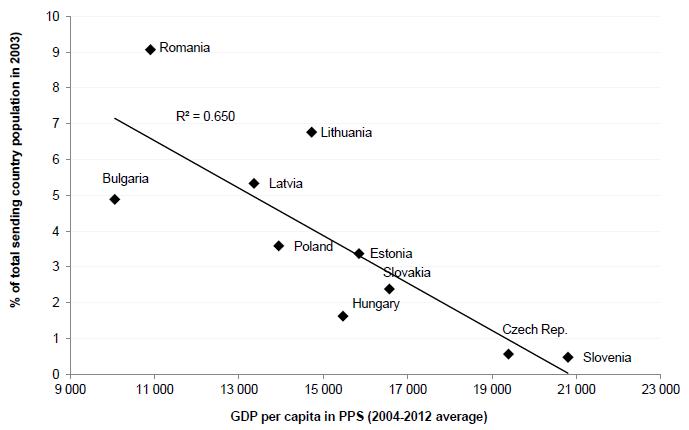
Source: own elaboration based on Eurostat data.
Taking the above into consideration and examining the relationship between migration rates and 2004–2012 GDP averages, we find a slightly weaker correlation than for the period examined by Bahna (2008), and emigration from Hungary appears somewhat exceptional, with a comparatively lower rate than its post-accession economic development might have suggested (Figure 2).4 This ‘relative immobility’ has represented Hungarian society since the early days of capitalist transition when, amidst rapidly growing unemployment and radical economic restructuring paralleling the opening of borders to free movement, Hungarians exhibited an inclination to bide their time, to postpone their decisions on migration (Szoke 1992: 318). We can observe a similar attitude during the financial crisis of 2008–2009, and an increasing impatience and loss of faith four years after the downturn.
As we can see in Figure 3, employment in some segments of the economy – primarily in the public sector – has been in decline since 2005, while the private sector suffered the most between the third quarter of 2007 and 2011. The largest growth in employment between 2008 and 2011, and again since 2012, was registered in so-called ‘public employment’ – an artificial employment and training programme for those out of work – and in the number of those working abroad, who are unlikely to benefit from and fully contribute to the national economy. Paralleling the negative changes in employment, the population’s subjectively perceived level of poverty has also reached a new constant peak (Figure 4). More than a quarter of households feel that they are making ends meet ‘with great difficulty,’ and one third of the total population is deemed to be ‘at risk of poverty and social exclusion,’ a return to pre-accession levels. At the same time, following a crisis-induced rise between 2008 and 2010, the unemployment rate remains above 10 per cent, even after the inclusion of emigrant workers in labour-market statistics.
Figure 3. Decomposition of the cumulative change of employment in Hungary in 2005–2013
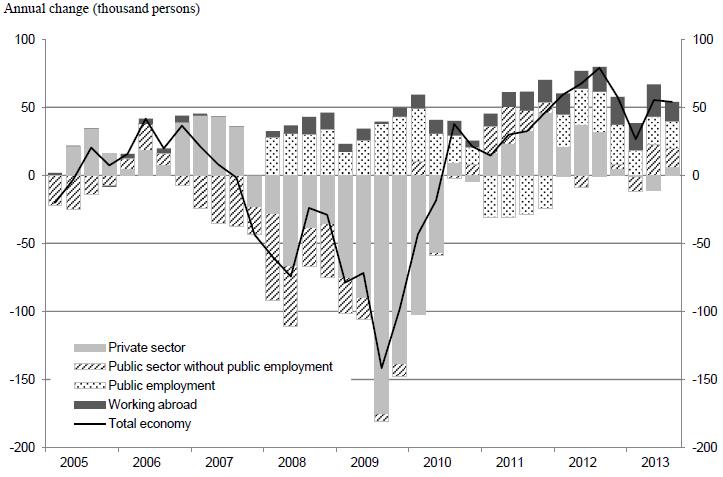
Source: Dóra Bak, MNB (2014b).
Figure 4. Unemployment and subjective poverty in Hungary in 2005–2013
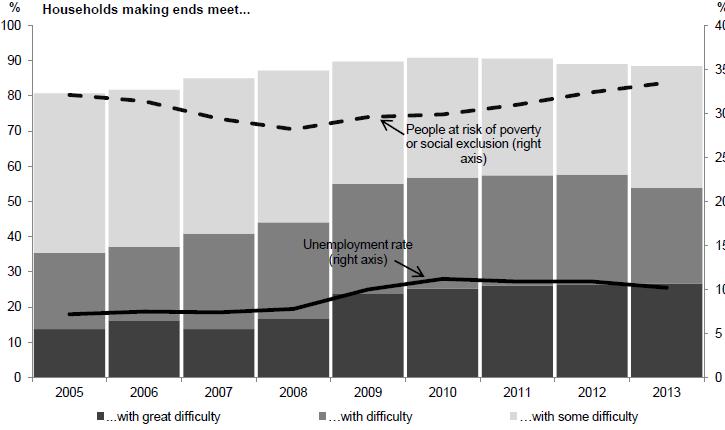
Source: Eurostat (SILC) [ilc_mdes09], [une_rt_a], [ilc_peps01].
Unemployment and low incomes, however, are only partially responsible for subjective poverty, another factor having to do with the specific and long-term impact the crisis has had on financial institutions and foreign-exchange rates (Åslund 2010). The proliferation of credit options – especially the advantageous contracts based on foreign currencies – has led to a high level of household debt vulnerable to currency fluctuations, subsequently driving many debtors into insolvency (cf. Rona–Tas, Guseva 2013). In Figure 5 we can observe the increase in the amount of household debt incurring payment difficulties during the first half of 2010, and the growing share of debt with payment delays of over a year, thereafter. This trend shows that a substantial amount of debt is ‘fossilising,’ with increasing amounts becoming classified as ‘problematic’ or outright ‘bad.’
Figure 5. Volume of household debt in Hungary by late payment and status in 2009–2014
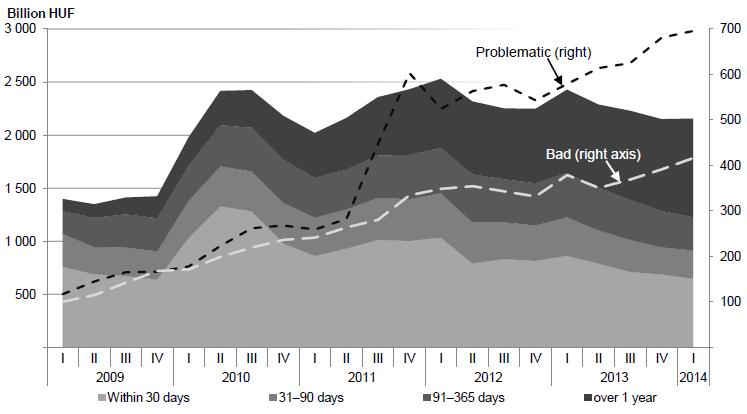
Source: own elaboration based on data from MNB (2014a).
Far from constituting a Hungarian specificity, foreign currency mortgages were widespread throughout Central Eastern Europe, and especially in the Baltic states, and governments have intervened in different ways to ‘save’ the debtors, however belated these measures may have proved for many (Rona–Tas, Guseva 2013). While household debt may have contributed to migration decisions everywhere in the region, it certainly represents an important economic factor in Hungarian migration, as the migrants’ narratives presented in the third section of the paper will corroborate. If Hungary’s low migration rate in the early post-accession years was, indeed, due to an ‘inclination to bide time,’ the slow and steady pace of economic decline – as somewhat different from the sudden shifts characterising economic development in the Baltics – would have favoured such strategies and could also explain the recent rise in emigration.
As we saw in Figure 3, the share of emigrants in the economy was already visible during the crisis years, but has increased significantly since the second half of 2011 and, today, migration has become a very topical issue in Hungarian media and political discourse (Kapitány, Rohr 2013). With migration potential surveys registering alarmingly high rates, especially among students and youth, it is also bound to be an enduring phenomenon (Gödri, Feleky 2013). Reliable data on emigration are scarce, with the number of those living abroad estimated at anywhere between 195 000 (Blaskó, Jamalia 2014) and 335 000 in the 18–49 age group alone (Kapitány, Rohr 2013). According to Eurostat data, a total of 257 299 Hungarian citizens were living in the EU15 at the beginning of 2013 and, according to national statistics in the two main destination countries – Germany and the United Kingdom – the increase in the number of Hungarian nationals during 2013 was higher than in any single previous year after EU accession (based on data from the Department for Work and Pensions and Destatis). In the following section I will explore the available statistical data on migration to the United Kingdom more closely.
Hungarians in the UK: demographics, geography and economic activity
Leaving aside the actual extent of flows, we can identify different patterns in the migration from CEE countries that joined the EU in 2004, shaped by the distinct push factors in each country of origin. As shown in Figure 6, there are two dominant types – the ‘double-hump’ trajectory of migration from the Baltics, and the ‘single-hump’ pattern characteristic of Central Europe, from which Hungary started diverging in 2008. That year, while migration rates from other countries in the region declined, migration from Hungary saw a modest increase, and flows stabilised at around 14 000 per year (about 20 times higher than before accession) until 2011, when they began increasing again. As we can see, before 2006, migration from Hungary to the United Kingdom was moderate, lower even than migration from the Czech Republic, and only in 2010 did it exceed the falling immigration rate from Slovakia (a country with a population just over half that of Hungary) in both relative and absolute terms. In the previous section I discussed some socio-economic factors that may have contributed to this change in migration patterns, and in the next section we will also examine migrants’ reasoning. Another socio-political factor that I will not be dealing with extensively in this paper but which, nevertheless, requires mentioning, is the possible mobility consequence of the 2010 change in Hungary’s citizenship law (Law no. XLIV of 2010). The new legislation allowing for the preferential naturalisation of ethnic Hungarians living outside Hungary has yielded over 500 000 new citizens since January 2011, and a proportion of those registered as Hungarian migrants in other countries may be such ‘dual citizens.’ Although Kapitány and Rohr (2013: 1), for instance, assume that a significant part of those appearing in the mirror-statistics since 2011 are Hungarian citizens who have never lived on the territory of Hungary, there are no data on the precise numbers.5
Figure 6. Patterns of CEE migration to the UK
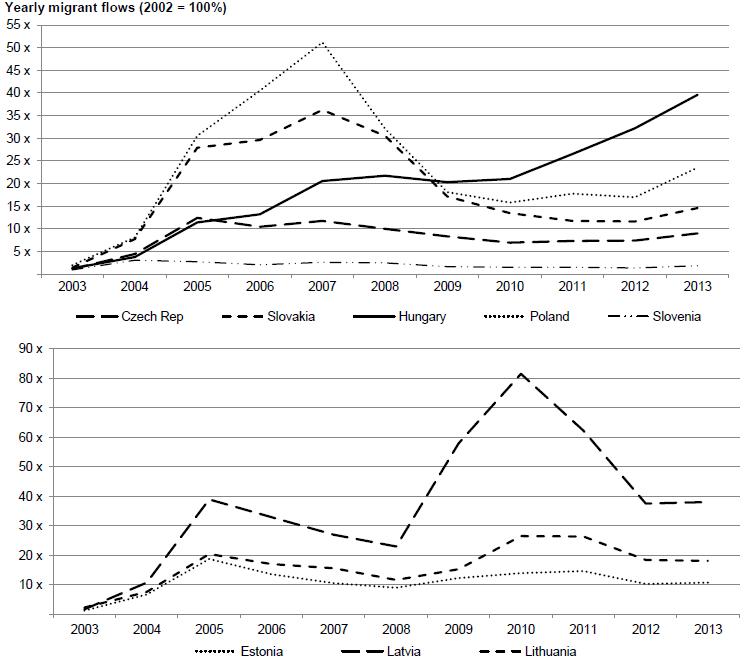
Note: Based on National Insurance Number applications (NINo).
Source: own elaboration based on data from the Department for Work and Pensions (Stat-Xplore).
Based on a combination of population-census and national-insurance data, I estimate the number of ‘usually resident’ first-generation Hungarian migrants in the United Kingdom to have been around 76 000 in April 2014 (see Figure 7). This estimation is based on census 2011 data complemented with the weighted number of post-census National Insurance Number (NINo) registrants believed to have stayed along.6 We can infer this latter ratio by comparing year-of-arrival data from the census with the number of NINo registrations during the same period, and I have used a 46 per cent rate for my estimation of migrant stock increase between March 2011 and March 2014 (see Table 1). With all their deficiencies, I consider these sources and method to be currently more precise than Annual Population Survey data.7
Figure 7. Stock and flow of Hungarian migrants to the UK
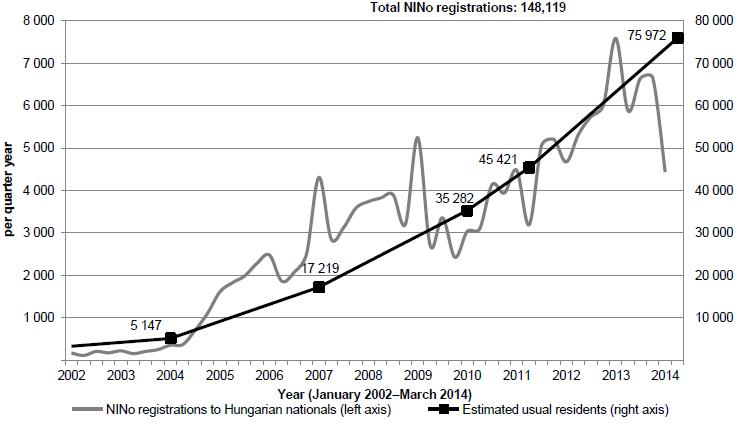
Source: own calculations based on UK census 2011 (Office for National Statistics; Northern Ireland Statistics and Research Agency; National Records of Scotland) data and NINo data (Department for Work and Pensions).
Table 1. Hungarians in England and Wales in 2011
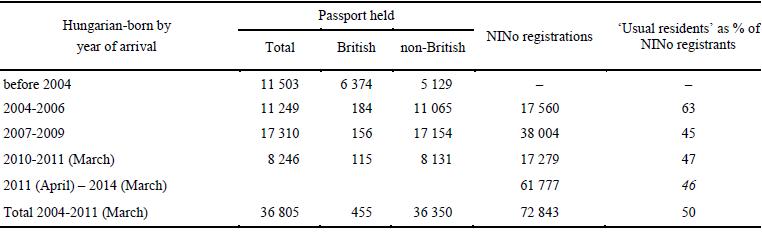
Note: All data are for England and Wales only.
Source: UK census 2011 (Office for National Statistics) and Department for Work and Pensions.
The re-migration rate is, in itself, interesting to examine. As shown in Table 1, the 2011 census recorded 5 129 Hungarian-born residents in England and Wales who did not hold a UK passport and who had arrived before 2004. Only 11 065 had arrived in the three years following Hungary’s EU accession, while the majority (17 154) went between 2007 and the end of 2009, and a proportionate number (8 131) during 2010 and the months before the census. If we look at the inflow of Hungarian nationals during these same periods, as represented by NINo allocations, we find that 63 per cent of those registering between 2004 and 2007 were still residing in England and Wales in 2011.8 This rate is only 45 per cent for those who requested a national-insurance number between 2007 and 2010, and slightly higher (47 per cent) for the more-recently arrived. This is somewhat counterintuitive, as we would expect the more recent arrivals to still be present in greater proportions than those who had arrived earlier. There are several possible explanations for this. One is that there has been a shift in mobility types, from a longer-term and more stable migration to a more ‘fluid,’ ‘liquid,’ ‘circulatory’ type of mobility, seen as increasingly representative of intra-EU movements (Engbersen, Snel, de Boom 2010; Kupiszewski 2002). Another possibility is that, among those applying in the early period, many had already been living in Britain for a while, with clearer intentions of settlement but without access to national insurance. This thesis is in line with empirical evidence concerning the ‘status regularisation’ effect of EU accession, especially in relation to Polish migration (Anderson, Ruhs, Rogaly, Spencer 2006; Portes, French 2005). In fact, in the case of Poles – who represent the historically most established and single largest group of CEE nationals in the UK – we find an even more striking contrast: 80 per cent of those who arrived between 2004 and 2007 were still present in 2011, compared to 45 per cent and 58 per cent for the following two groups respectively (based on data from the Office for National Statistics and the Department for Work and Pensions). It is therefore not a Hungarian specificity, but probably a more general consequence of the financial crisis affecting newcomers to a greater extent (cf. McCollum, Findlay 2011). Overall, the mobility of Hungarians seems more ‘fluid’ than that of Poles, only half of the total post-accession NINo registrants showing up in the census, compared to 60 per cent for Polish nationals. However, considering the issue discussed above, for the purpose of estimating the proportion of stayers among those registering since the census date, I used a 46 per cent rate, the average for the previous two cohorts in England and Wales. As we saw in Table 1, more new arrivals were registered in the three years since the census than during the six years immediately following Hungary’s EU accession, with the highest rise during 2013.
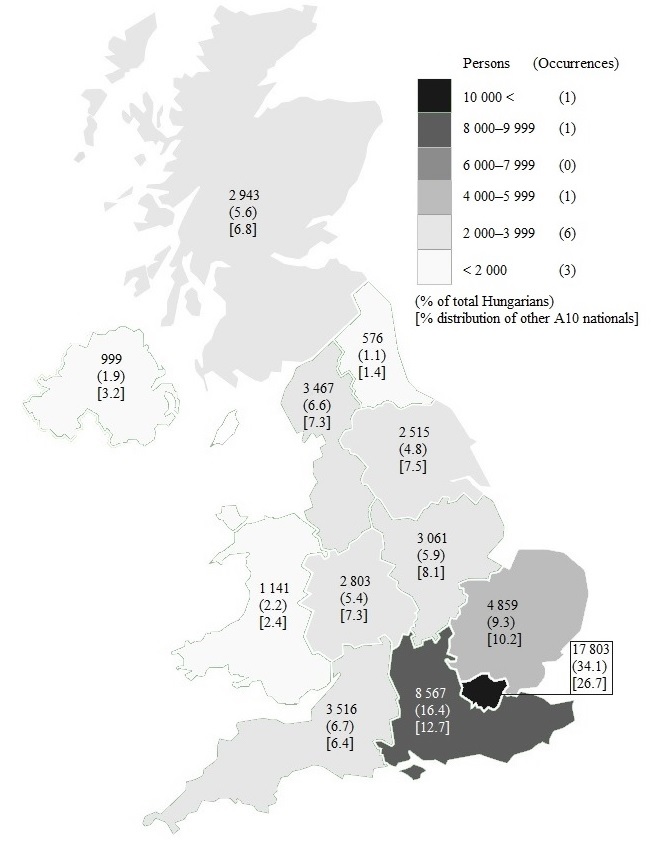
Map 2. Geographic distribution of Hungarians in the UK in 2011
Source: own elaboration based on UK census 2011 (Office for National Statistics; Northern Ireland Statistics and Research Agency; National Records of Scotland).
A third factor relating to re-migration rates is that they also cover some internal migration, as a proportion of those registering for national insurance in England and Wales may have subsequently moved to Scotland or Northern Ireland, which appear separately in census statistics. However, considering the number of Hungarian nationals living in these regions, this factor should not have played too great a role. In terms of geographical distribution, at the time of the census more than one third of all Hungarian-born usual residents lived in London, a somewhat higher rate than for other A10 migrants (see Map 2) (cf. Bauere, Densham, Millar, Salt 2007). Within London, Hungarian speakers were more concentrated in the northern boroughs, with 28 per cent living in Brent, Haringey and in the lower wards of Barnet, home to only one tenth of all Londoners (see Map 3). Since then, first-time national-insurance application data show an increase towards the eastern boroughs, especially Newham and Waltham Forest (based on data from Department for Work and Pensions).
Map 3. Hungarian speakers in London wards in 2011
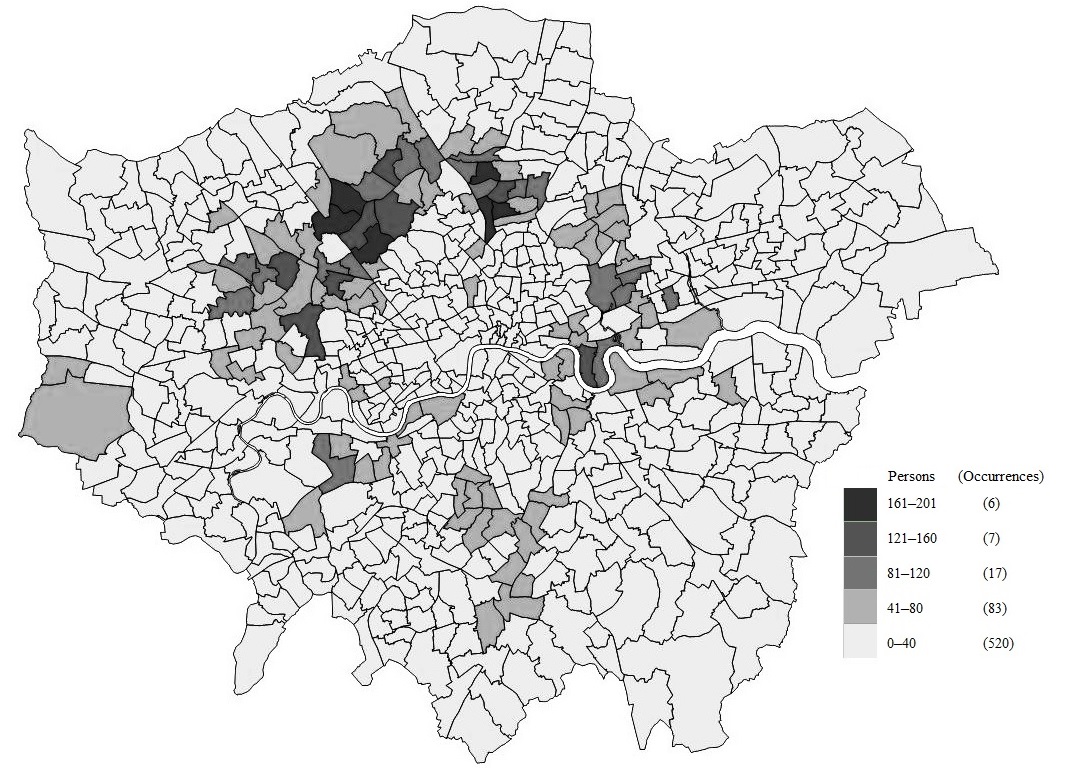
Source: UK census 2011 (ONS) [QS204EW]. © Crown copyright. All rights reserved GD272183.2014.
There is a dearth of useful data sources for the internal migration of resident foreign nationals but, when analysing the location of first-time NINo registrations over time, we can observe a general trend of dispersal.9 The share of Hungarians registering in London decreased every year between 2004 (44.3 per cent) and 2007 (33.5 per cent), and then increased steadily each year from 35.6 per cent during 2008 to 43.1 per cent in 2012, followed by another decrease in 2013 (40.9 per cent). Considering what we know about the role of social networks in migratory movements, it is safe to assume that many of those registering in regions outside London between 2005 and 2008 were following in the wake of acquaintances who had moved internally (cf. Trevena, McGhee, Heath 2013). If this is so, then the rising trend in new registrations in London may indicate a change in mobility types, as I have already speculated on above. Apart from being more ‘fluid,’ then, this second type of post-accession mobility may also be more ‘individualistic’ and reliant on ‘weak ties’ (cf. Granovetter 1973). Further, the percentage of Hungarians living in the capital must have increased over the last three years.
Figure 8. Age and gender of Hungarians in the UK
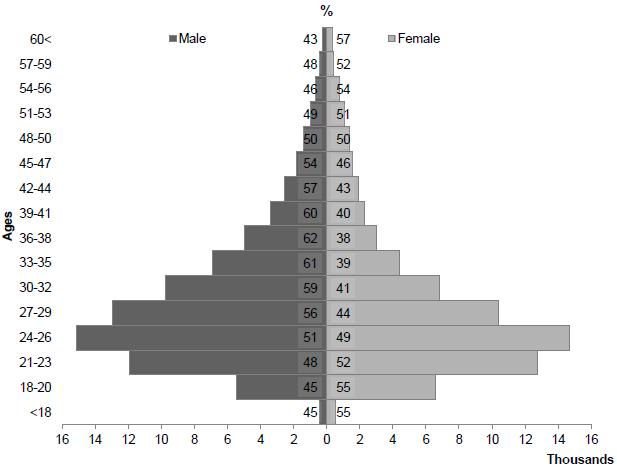
Note: Based on National Insurance Number applications (NINo).
Source: own elaboration based on data from the Department for Work and Pensions (Stat-Xplore).
Another demographic characteristic of intra-EU mobility in general is the greater equality in gender balance than that which is representative of classical forms of labour migration; especially in their initial phase, these are dominated by young males (cf. Castles, Miller 2009; Recchi, Favell 2009). The age and gender of Hungarian migrants to the UK seem to replicate intra-EU trends. Considering all national-insurance applicants since 2002, Hungarians in the UK are generally young (80 per cent are aged 18 to 35), 53 per cent are male and 47 female (Figure 8). However, as the gender composition of Hungary’s over-15 population is the exact reverse, we can see an overrepresentation of men among labour migrants in the 27–44 age group. This trend is representative of CEE migration more broadly, placing it between classical forms of labour migration and the mobility from old EU member-states. Overall, it is characterised by greater diversity in motivations, aims and opportunities for both young men and young women (cf. Recchi, Favell 2009).
Table 2. Economic activity of working age A12 migrants in England and Wales in 2011
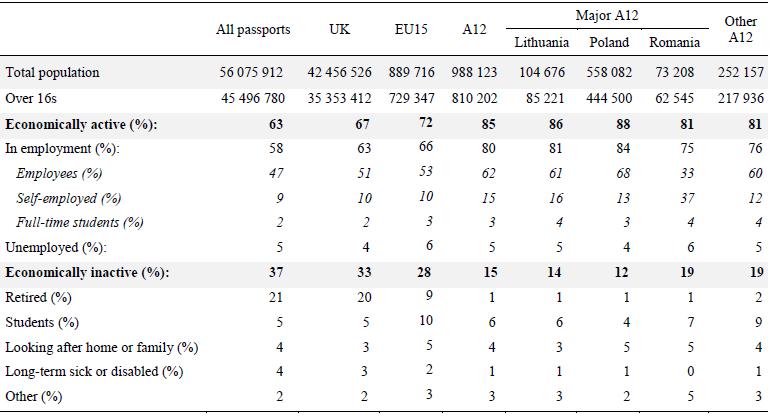
Note: All percentages refer to usual residents aged 16 and over.
Source: UK census 2011 (Office for National Statistics): [DC6209EWR],[DC2110EWR].
Table 3. Occupation of working age new A12 migrants in England and Wales in 2011
Note: All data refer to usual residents aged 16 and over who arrived between 2001 and 2011 and were in employment the week before the census (27 March 2011).
Source: UK census 2011 (Office for National Statistics): [CT0078].
Differences between the mobility of old and new EU citizens are greater in terms of their economic activity. Unfortunately data broken down to individual nationalities are limited in this respect, but allow for a general assessment of the A12 countries comprising Hungary (cf. Table 2 and 3). As we can see in Table 2, important differences exist not only between UK, EU15 and A12 nationals, but also among accession-country migrants. Overall, A12 migrants are economically more active than those from the old member-states who, in turn, are more active than UK nationals and the average working population. Of those who arrived after 2001 and were in employment at the time of the 2011 census, A12 nationals are underrepresented in professional and managerial positions, and are more likely to be employed in skilled trades and industry (including construction) – and more so for Poles than other A12 nationals, with one third working in elementary occupations (Table 3).10
The main differences in economic activity between British, EU15 and A12 nationals are in the size of the retired and student population (Table 2). Interestingly, we can see differences along similar lines between Poles – the major migrant group – and other A12 migrants, especially in the ratio of students, with 13 per cent of working-age migrants from accession states other than the three major origin countries counting as students (either in employment or inactive), compared to 7 per cent of Polish migrants. The second major difference among A12 migrants lies in the number of self-employed, primarily due to the high percentage of Romanian and Bulgarian nationals choosing this route, although Lithuanians are also more inclined towards self-employment.11
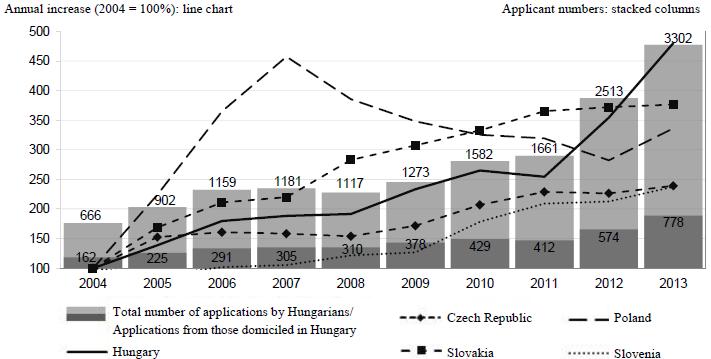
Figure 9. Change in Hungarian and CEE applications to UK universities in 2004–2013
Source: own elaboration based on data from the UK Universities and Colleges Admissions Service (UCAS).
We can find more specific data on student numbers from the UK Universities and Colleges Admissions Service (UCAS). As Figure 9 shows, there was a sharp increase in 2012 and 2013 in the number of applications to UK higher-education institutions by Hungarians, both in absolute terms and relative to other CEE nationals (cf. Makó, Tóth 2014). The number of applicants was 3.5 times (354 per cent) higher in 2012 than in 2004 and almost 5 times higher in 2013, more than twice that of the previous years’ average. These ratios are equally valid for applicants domiciled in Hungary, and for the total number of applicants (including those Hungarians applying from within the UK).
These comparative trends in student mobility parallel those we have seen in Figure 6 in respect to labour migration, and raise further questions regarding causal mechanisms that are specific to Hungary. In the following section I will draw on qualitative narrative interviews, collected during personal ethnographic fieldwork undertaken in the summer of 2013 in London,12 to gain a better contextual understanding of the processes highlighted above. While the fieldwork had a wider scope, for the purposes of this paper I will focus more closely on those migration stories which are the most representative of wider social phenomena, and examine further the contextual factors affecting migration decisions.
Hungarians in London: reasons, aims and adaptation
In the previous section I outlined some demographic and geographic characteristics of Hungarian migration to the United Kingdom, and formulated several assumptions regarding the character of this mobility. As we saw, it is a rather ‘fluid’ and ‘individualistic’ type of mobility, involving predominantly young men and women, with a greater preference for London than in the case of other A10 migrants. It is also relatively recent, with a major upsurge over the past two years in both labour and student mobility. In the following section I will further explore some of these characteristics by highlighting certain major themes related to migrants’ motivations, aims and settlement as they emerged from narrative interviews.
Preliminary results from a recent online survey (associated with the Leave/Stay project)13 may also be helpful in guiding our discussion. On a large (N = 5 200) but non-significant sample – in which those with higher education seem over-represented – the survey found that 77.8 per cent of Hungarians in the UK migrated for work (about half of whom had a job offer before they moved), one in ten people had followed a partner, 7.2 per cent moved for studies, and just over 5 per cent went there without any specific aim, to ‘try their luck’ (MTA 2014). Before moving, 70 per cent had been in employment, 16 per cent had been studying, and the remaining 14 per cent used to be unemployed, economically inactive, or sporadically employed on a short-term basis. One in five respondents considered ‘better study prospects’ and ‘curiosity, adventure’ as important factors in their migration decision, whereas two-thirds mentioned ‘higher living standards,’ and more than half, ‘better job opportunities.’14 For almost 20 per cent of the respondents, ‘loan repayment’ was an important factor, and for 10 per cent ‘financing a business’ topped the reasons for leaving Hungary behind (MTA 2014). We should bear in mind that the two latter reasons are more specific than the general dissatisfaction with the economic situation in Hungary or the higher living standards and job opportunities in Britain, and they seem to reflect the experience of a more substantial number of people than the multitude of individual reasons that may exist. With his one-year experience as a migrant, Bence was unequivocal that:
There are three types of Hungarians in London: those like me, who came here to work because they had lost their jobs or businesses and have families to support; those with no obligations back home, without families and free to do what they wish; and those who had a mortgage and could no longer pay, losing their houses (Bence, 44 years old, 29 May 2013).15
This ‘emic’ evaluation has proved quite accurate, and many of my interviewees mentioned difficulties in supporting their businesses, or being unable to pay their mortgage, as their main reasons for migrating.
Bankruptcy and the spectre of debt
I proposed earlier that the slow and steady pace of economic decline and the ‘fossilisation’ of household debt may have had an influence on both delaying migration projects and the recent increase in emigration. Migrant narratives can help us to understand the mechanisms behind such processes, and here I will briefly present two telling cases of former entrepreneurs and foreign-currency mortgage debtors.
According to Bence, who has been a painting contractor for almost fifteen years, the business environment in Hungary has been deteriorating slowly but steadily ever since he launched his enterprise in 2000, and plans to migrate have been on his mind ever since:
My main reason for leaving is that I used to be a contractor and my business went bankrupt. There was this debt running in circles, and [subcontractors] were ‘forgetting’ to pay me... and I haven’t been paid up to this day. (…) This situation has been constant, but kept worsening year after year. Around 2000 – this is just a rough estimation – in 7–8 jobs you ran into a situation [where you were not paid] maybe once. You can survive that. Then by 2011–2012 I was virtually merely covering my costs. Of 7–8 contracts, around half were not settled (Bence, 44).
In the experience of Balázs, who had worked in television for over twenty years, and at the time of the fieldwork had been in London for almost a year, the situation in the media production business in Hungary was nothing better. He had also run his own company, producing media contents for television stations and advertising agencies:
My last contract ended in December 2011, and I could feel that I wouldn’t be able to secure other jobs. Before that I hardly had finished a job and another one was already lined up, and often I had to give up contracts for lack of capacity. My last job was a two-year contract, with fewer and fewer parallel commissions, and by the second year it was the only one I held. That contract ended on 31st December, and around February I began realising that there may be no other choice for me than to leave (…), and finally in July I decided to leave. I had by then used up my savings (Balázs, 47 years old, 27 May 2013).
In the cases of both Bence and Balázs we can discern the previously hypothesised tendency to ‘bide time’ and postpone migration projects until all other options are exhausted, as with those who became caught up in the trap of foreign currency mortgage debt. Accounts of mortgage default-induced migration are all very similar:
We had taken out not one loan, but four loans (…) and as long as we could pay them from our salaries, it wasn’t an issue. It became an issue when we took out a loan denominated in Swiss francs, and that hadn’t been an issue either for three years (…), but things changed in 2009 when the economic crisis hit and the rates started increasing. Then we took out another mortgage to buy off this one. (…) Finally I decided to leave because I could not afford the instalments (Luca, 46 years old, 6 June 2013).
Apart from influencing migration decisions, debt may also affect the migration life-course in other subtle ways. Adam (50), for instance, sees the freedom opened up by EU accession as ‘salvation,’ while at the same time experiencing his migration as an ‘entrapment’: For me there is no return. I took out the foreign-currency mortgage, I defaulted, and now I can’t do anything back home because the taxing authority would immediately come and take my entire income (Adam, 50 years old, 30 May 2013).
Political corruption and policy miscalculations
While the economic crisis is acknowledged in the narratives above as a major cause of their economic hardships, many migrants perceive ‘politics’ – or political corruption – as the main culprit. In the Leave/Stay survey, almost half of the respondents answered that ‘bad political situation’ was a main reason behind their migration (MTA 2014). In my interviewees’ accounts, this overly general diagnosis concretised around very specific practices and policy decisions. For Bence, the ‘debt running in circles’ he mentioned was spiralling downwards within large state-funded infrastructural projects run by businesses related to political actors and involving a great number of subcontractors, with payments ‘vanishing’ somewhere along the way. According to him, the main problem lay in the very practice of commissioning government projects:
Bids were settled at governmental level; it was in vain for a contractor to bid with a normal price, his application was not even considered… the contract always went to the lowest bidder, and everyone knew what this entailed (Bence, 44).
This practice, if indeed widespread, was ingrained in the economic and political culture of post-socialist marketisation and less connected to any particular political party. Others cite transformations taking place more specifically after the 2010 elections and the formation of a two-thirds supermajority government. Having worked primarily for national television channels, Balázs has also voiced his suspicions regarding the reasons why he no longer received new media production contracts, his accusations reflecting the wider social anxiety about growing government influence on the state media. These concerns led, in 2012, to Hungary’s ‘Freedom of the Press’ rating devaluation by Freedom House, which deemed that, By creating a central property management and production fund, the government deprived three previously independent institutions – Hungarian Television (MTV), Hungarian Radio (Magyar Rádió), and Danube Television (Duna Televízió) – of their financial and organisational autonomy (Freedom House 2012).
Policy miscalculations in the area of education have also been referred to by some migrants. For Laura (41), who had been a teacher for fifteen years, the final push came as a consequence of a change in the law on public education, which now made it easier for local authorities with financial difficulties to hand over schools to religious institutions and escape the burden of having to maintain them (see Law LI of 2010):
There has been a change of administration at the school where I used to work, and its management was taken over by the Reformed Church. (…) We had got used to working in a state school, many of us had been teaching there for 30–35 years, and now they brought in a totally new perspective, a new system… everything changed. (…) They told us they would like to work with us, that it is not an issue if we are not Protestant – I’m Catholic – we don’t have to become that… but when the time came, we experienced otherwise. Many things happened that no longer worked for me (Laura, 41 years old, 28 May 2013).
As Laura stressed, she and her husband had long cherished the dream of ‘experiencing living abroad,’ and what happened with her school only ‘came as a sign.’ It is, however, due to such policy miscalculations that a general dissatisfaction with the ‘political situation’ is becoming dominant, leading many to take advantage of the liberties offered by EU freedom-of-movement provisions.
Higher education policies and youth mobility
Education policies – especially those affecting the higher education sector – have had a much wider influence on migration potential, shaping the mobility aspirations of an entire generation of young adults. While higher education has generally been state-subsidised, the introduction of fees has often topped the political agenda in the past twenty years and, to gain approval, proposals have invariably taken the shape of rather complex arrangements. Since 2011 the rifest debates have been around the introduction of a ‘student contract’ requiring state-funded students to work in Hungary for a certain period after graduation in order to recompense society for what it had invested in their education. The finally adopted and currently enforced law sets rather loose terms for this requirement; however, the enduring uncertainties regarding its content and a gloomy media discourse have made university education in Hungary seem less attainable and more risky.16 The popular reference to the ‘contract’ – or, rather, ‘declaration’ – by means of a historically charged expression denoting the boundedness of medieval serfs exacerbates the contrast with EU ideals of free movement, highlighting the latter as a viable alternative.
It is thus no surprise that Hungarian applications to UK universities have multiplied over the past two years, even amidst rising tuition fees (as seen in Figure 9 above), and that, in a recent survey, secondary-school students in their final years came out as the subgroup the most inclined (52.8 per cent) to nurture migration ‘plans,’ with many of them (23.5 per cent) aiming to continue their studies abroad (Gödri, Feleky 2013: 3). Another fresh survey of secondary-school students’ aspirations shows that 5.9 per cent of those planning to continue their studies have applied to foreign universities and, of those terminating their studies, 25.6 per cent wish to find employment abroad (Makó, Tóth 2014: 16–18). One of the migration stories which best captures young people’s attitude towards mobility is that of Viktória (22). Following secondary school, Viktória, originally from a southern county of Hungary, studied applied graphic design at a further education college in Budapest. In the meantime she was accepted by a top provincial university, but chose to leave the country instead:
I thought it through, that I have two–three options; the first – and most important – is that I begin my university course. But I know myself, and I know I have high expectations, and that my mother is raising me on her own, and I cannot expect her to support me at the age of 21–22, to ask for money whenever I want to go out or buy a new dress. (…) And, well, I wanted to leave, to live, I’m young, and I thought I could study here too. (…) I wanted to continue my studies as a graphic designer, and this is how I set off a year ago, that I won’t be a waitress for the rest of my life, but that I want to study… to earn an English certificate in graphic design (Viktória, 22 years old, 21 June 2013).
While the expected negative effects of youth emigration are an increasing cause for concern in Hungary, and there have been several recent governmental initiatives aimed at the ‘re-migration’ of qualified young professionals (Lados, Hegedűs 2012), the consequences of the latest wave of student migration are yet impossible to ascertain. The experience of Emma (28), however, leads us to believe that the reverse transfer of skills and qualifications acquired in Britain may be more problematic than many would expect. Emma first arrived in the UK on an internship while a student in Budapest, where she had been enrolled on her ‘dream’ course at an expensive private university. Here, the medium of instruction was English, for which she paid with revenues from a family property sale:
I didn’t want to do [the internship] back home, because my classes were in English anyway, and [in Hungary] I wouldn’t have learnt anything new (…). In the end London caught my fancy so much that I began inquiring about courses, and I found one (…) that was similar to the one back home. I got in touch with the course director, and I was able to arrange for a transfer and finish the last year of my degree here (Emma, 28 years old, 2 July 2013).
She took out a UK student loan to cover the fees, which – she says – were lower than what I had to pay in Hungary, and the conditions of the loan are also better than back home, while also working as a nanny alongside her internship and studies. After her graduation in 2011 she returned to Budapest enthusiastic about the career prospects her British qualification, international experience and language skills would open up, but she encountered difficulties:
So I went home, and (laughs) could not find any work, because when I told them that I graduated in London, everyone was like: ‘Oh, oh, London! Oh, okay, so you must be a millionaire. Then what do you need a job for?’ So, the general attitude was something like this, and I was truly flabbergasted… (Emma, 28).
She remained in Hungary for a year, doing temporary jobs only remotely connected to her qualification and, in October 2012, she decided to return to London: I tried [to manage] back home with best of heart, but if this is their attitude…
The stories of Viktória and Emma also confirm that, within the EU migration system, educational, economic and leisure motivations become conflated, disturbing supposed dichotomies between ‘skilled’ and ‘unskilled,’ ‘elite’ and ‘non-elite’ mobilities (Parutis 2014). As has become obvious from many interviews, the level of English-language competence is the skill which plays the greatest role in migrants’ opportunities. Language is a factor shaping migration motivation and hindering adaptation at the same time, while impacting on employment and earning potential (Dustmann, Fabbri 2003; Johnston, Khattab, Manley 2014). In what follows, I examine these two aspects of language competence before closing with a discussion of the ‘migration industry,’ yet another important element influencing migration decisions and adaptation.
Language competence and labour-market incorporation
For the younger generation, English represents their first foreign language. Over and above its better salary prospects, moving to Britain is also seen as an opportunity to improve these language skills (cf. Parutis 2014). Viktória, whom I introduced earlier, arrived to London with limited practical language abilities although she had studied English at school; this made it more difficult for her to continue her education in Britain as planned:
I could not see myself not finding a job, and I found a job [as a waitress] within a week (…) I believe that there are certain steps: cleaner, waitress, receptionist… I’m young and I would work as a cleaner only as a last resort, because as a cleaner I could not practice the language; (…) as a waitress I have to communicate with the customers, they sometimes talk about the weather, where they work, so I can progress (…) My final, final, final aim would be to… I would very much like to work for the BBC as a graphic design editor. Yes, I know it sounds crazy, but… (…) The key is to learn English well, (…) to be able to express myself more eloquently (Viktória, 22).
Viktória shows a clear expectation of professional advancement from ‘any job,’ through a ‘better job,’ to her ‘dream job,’ a transition observed more widely among new migrants in Britain (Parutis 2014). Although dissatisfied with her current employment – the second since she arrived in London a year earlier – and seeking to make her next step as a receptionist, she does not see her job as a trade-off between student life in Hungary and higher incomes in Britain, but as a necessary stage in her career development. Her knowledge of English was good enough to allow her not to begin her migrant career from what she perceives to be the lowest ‘rung’ on the ladder of success, but it may still be insufficient for advancement. She enrolled on a free language course at a local college, but her current job is less flexible, making it harder for her to complete her course, a common concern among those planning to combine work with studies.
It is worth placing these issues in a wider social context. There is a general dissatisfaction in Hungary with the population’s overall foreign-language skills, a frustration increasingly voiced in the wake of recent data on foreign-language competence across the EU, and national statistics regarding the falling number of language exams (European Commission 2012; KSH 2014). Among EU27 nationals, Hungarians feel the least able to understand English well enough to follow radio or TV news (12 per cent), to read press articles (12 per cent), or communicate online (16 per cent) (European Commission 2012). What ultimately makes the younger generation more susceptible to assuming the risks of migration while lacking confidence in their English-language ability is, on the one hand, a conviction that being abroad is the best method of language-learning and, on the other, the requirement that a university degree may only be granted to those possessing a language-test certificate. This latter stipulation is the reason for one quarter of all university graduates in Hungary not receiving their diplomas (KSH 2014: 39). The situation has worsened in the past couple of years as a consequence of changes in the higher education admissions system, whereby extra points can be earned from a greater variety of different sources than for language tests alone. According to language-teaching professionals, this situation is partly to blame for the continuous decrease in the number of language exam attempts since 2010 (KSH 2014), and also explains why interrupting one’s studies for a period working abroad – as was indeed the case for several of my interviewees – or preferring post-graduation employment abroad below one’s qualification level, makes sense not only economically but also academically.
For many older-generation migrants, English is their second foreign language, as they studied German at school instead. In many cases family or friends were the main reason for going to Britain, and they often emphasise the openness of English society and the British labour market, which makes it easier to integrate even with limited language skills. Máté is representative of the 10 per cent who had followed a partner to Britain – as shown in the Leave/Stay survey cited at the beginning of this section – but their relationship ended soon after moving, leaving him on his own without any knowledge of English:
My greatest surprise was that I arrived here without speaking any English at all, and they still hired me; (…) I was still able to obtain the documents I needed in order to find employment, starting with the NI number… and I did it all alone (Máté, 37 years old, 29 June 2013).
Had it not been for his partner, Máté says, he would probably have gone to Germany, as he spoke German. For Jázmin it was precisely a brief and unpleasant previous experience in Germany which made her follow her friends to London in 2006, even though she did not speak English. She was also astounded by how easily she got her first job at a pub:
On the phone I didn’t even understand if I got [the interview] (…) I had prepared a monologue anticipating what they might ask me, confident that once there I could prove myself (…) [The manager] asked if I would like to work there and made [a wide gesture with his hands]. I didn’t understand a word, and thought he was asking if I had worked in a place like that before. I said no (…) He asked me two more times, probably thinking that I’m demented, and in the end I said ‘Yes’ (…) The manager just laughed and laughed (…) and he must have pitied me, because I got the job (…) To succeed in the hospitality industry you need to work hard, and smile. The English (…) take it much easier than a Hungarian would if, in a restaurant, they couldn’t understand the waiter (Jázmin, 34 years old, 3 June 2013).
Others have chosen Britain without having any acquaintances there. Balázs – whose difficulties in maintaining his media production business in Hungary we have already heard about – found employment as a hotel porter and later as a cleaner. Although he had never studied English, and Britain was not among his first choices as a destination, language nevertheless played a central role in his decision:
My first choice was Sweden, because my brother-in-law is there and I thought it is better to have at least someone who could help; but I don’t speak any Swedish, very little English, and if I must learn a new language, I would rather it not be Swedish, which I would make no use of later in life. My second choice was Australia, then New Zealand but, at 47, without knowing the language, it is impossible. (…) There was nothing left but England, where there are many (…) organisations on the internet, and they take care of everything (Balázs, 47).
The logical trajectory exhibited in Balázs’s testimony was very common among those who migrated without any language proficiency and with only weak social ties in Britain. From a behavioural economics perspective, such decisions could be explained as ‘expected utility maximisation’: with the risks roughly equal in Sweden and England – given the existence of the online ‘migration industry’ – the value of English as the global language is increasingly taken into consideration as an expected additional benefit, secured even if the main aims of the migration project ultimately fail. A final factor in the mobility of Hungarians to London that I outline here is the emerging online migration industry, which aided the migration and accommodation of many of my interviewees.
Accommodation and the online migration industry
As mentioned before, 2013 saw the highest influx of Hungarians in Britain and, at the time of my fieldwork, the ‘migration industry’ was booming. Describing it in relation to the Polish case, Garapich (2008) defines this special sector of the service industry as a set of specialised social actors and commercial institutions that profit directly not only from human mobility but also from effective adaptation into the new environment (2008: 736). As the first function is increasingly taken over by large multinational low-cost flight operators, services relating to migrant ‘adaptation’ are gaining ever greater importance. There are currently several companies offering different services to Hungarians wishing to move to London, and they play a crucial role in facilitating and perpetuating migration, making possible the more ‘individualistic’ type of mobility I alluded to earlier.
For the purposes of my fieldwork I appealed to the services of probably the largest – but certainly the best known and with the widest online presence – company providing temporary and long-term accommodation in London, with offices in both Budapest and the British capital. The firm, established in February 2004, acts mainly as a letting agency (primarily sub-letting, but with an increasing portfolio of company-owned properties), but also provides complementary free services to clients, such as job-search advice, CV editing, or booking interviews for national-insurance-number requests and bank-account applications. For a fee, it is even possible to arrange a pick-up from the point of arrival in the country, delivered by an associated Hungarian taxi service. The company also publishes a periodical informative booklet and maintains a website where affiliated businesses can post their offerings and opportunities. According to information on their webpage, they currently have more than 120 properties with over 600 available rooms and studio flats. The majority of the rooms are singles or shared by two people, equipped with the basic amenities – including broadband internet – and are located in the north, north-west and north-east of London (cf. the distribution of Hungarian speakers in London on Map 3 above). The company offers ‘short-term’ (four nights to two weeks) and a ‘long-term’ (over two weeks) rental options, with shared-room prices of 15 GBP per person per night for short-term stays, or between 60 to 100 GBP per week (around 75–130 euros), bills inclusive, for longer contracts.
Of course, not all newcomers live in accommodation provided by such agencies and most of their customers eventually move out to houses with lower occupancy and better conditions. Almost all of my interlocutors who had arrived during the previous twelve months were searching for a new abode – adhering to the general trend of ‘residential hypermobility,’ especially among those in the early stages of their migration, as observed by Trevena et al. (2013: 684). Nevertheless, under the conditions described above, the difficulty and risks of moving for someone without any ‘strong’ social ties or knowledge of English, but enough confidence in securing employment rapidly, are reduced to a minimum.
Recruitment agencies and individual recruiters are also actively present on web forums and in social-media groups, raising the confidence of transnational jobseekers and providing the missing link in the success of the resettlement, with all the well-documented risks and insecurities involved in such mediation (Garapich 2008; Trevena et al. 2013). As became apparent from my interviews, several agencies offering accommodation and employment mediation have gained a rather negative reputation, and many migrants consult and share their experiences of different intermediaries on specialised online blogs. The existence of such channels for the timely circulation of information and the possibilities they create for direct interaction between different actors – what we may collectively call the ‘online migration industry’ – is one of the distinct features of international migration in the age of the internet, and it is no less representative of Hungarian migration to the UK.
Concluding remarks
My aim in this paper was to describe and explain some of the migratory processes of Hungarian nationals. Compared to other countries in the region, Hungary has shown lower levels of emigration both before and following EU accession, but this trend has recently begun to change. Looking at the case of migration to the United Kingdom, immigration from Hungary intensified as rates from other Central Eastern European countries were declining. Based on my own calculations, the paper estimates that there are around 76 000 Hungarian nationals presently living in the UK, and that more than half of those entering the country with the purpose of taking up employment stay for a fairly short period. Like other CEE migrants, ‘fluidity,’ ‘individuality,’ a relative gender balance and a great variety of reasons, aims and opportunities are the main features of Hungarian post-accession mobility.
It is hard to appraise the future development of the phenomenon described above, as the lives of migrants are riddled with uncertainty. Some of those whose migration stories I have highlighted in this paper could easily be identified as ‘hamsters’ – according to the typology designed by Eade, Drinkwater and Garapich (2007) for Polish migrants in the UK – wishing to stay only for as long as necessary in order to achieve a certain goal. The majority of my interviewees, however, were ‘searchers,’ leaving open the question of return, expressing the wish to advance professionally and socially in Britain, and taking steps towards achieving those aims. Predominantly ‘young, individualistic and ambitious,’ as Eade et al. (2007) describe this group, their refusal to confine themselves to one nation-state setting underlines their adaptation to a flexible, deregulated and increasingly transnational, post-modern capitalist labour market (2007: 11). For them ‘in-betweenness’ is not something to be resolved, but to be lived as a lifestyle.
Others seem driven by an implacable frustration with circumstances in Hungary and, although – in contrast to the ‘stayers’ identified by Eade et al. – many have moved to Britain fairly recently, they are determined never to return ‘home.’ It is noteworthy that 38 per cent of the respondents to the Leave/Stay survey ‘are not planning to return at all,’ while another 35 per cent are ‘certainly not returning in the coming five years’ (MTA 2014). Two-thirds of the people in that sample arrived in the UK since 2010.
As I attempted to show in this paper, the latest rise in the mobility of Hungarians was engendered by a long economic decline and policy miscalculations. While the cases discussed here are far from representing all the migrants, they are well able to capture the many forces driving this ‘new’ mobility, which may become more dominant in Hungary’s second decade of EU membership than it was during the first.
Notes
1 In this paper I use the following taxonomic terms to group countries: EU15 as the ‘old’ EU member-states; A12 as the countries which joined the EU in 2004 and 2007; A10 as the countries which took part in the 2004 enlargement; A8 as the Central European and Baltic members of the A10; A2 as the two Eastern European countries which took part in the 2007 enlargement; and the CEE as the A8 plus A2.
2 Author’s calculations based on Eurostat data (cf. Figure 2).
3 Among all A12 countries, only Estonia and Latvia registered GDP decreases in 2008 while, in 2009, when the recession had truly reached Central Eastern Europe, the fall in total GDP compared to the previous year was a further 14.1 per cent in Estonia, 17.7 in Latvia and 14.8 in Lithuania, more than three times the EU28 average of 4.5 per cent, and twice the 7.8 per cent of Slovenia, the next highest in the region (Eurostat data). For a detailed analysis of the financial crisis in the CEE, consult Aslund (2010).
4 Indeed, based on 2004 GDP rates, the coefficient of determination is 0.718.
5 My own Freedom of Information request with the UK Department for Work and Pensions, which might hold relevant information, has not yet received a reply.
6 These statistics need some specification. My analysis relies on the CT0161 census dataset on ‘passports held by year of arrival in the UK by country of birth,’ containing only data for England and Wales. For national representativeness I added data from the Northern Ireland [QS206NI] and Scotland [QS203SC] census detailing only ‘country of birth.’ In the final count, however, I excluded those Hungarian-born in England and Wales who possessed British passports, the majority having arrived prior to 2004 and, in fact, two-thirds before 1970 (see Table 1 above). This option was not available for the Irish and Scottish data but, as the number of Hungarian-born registered there is very low (999 and 2 943 respectively), this should not distort the estimation significantly. The non-Hungarian-born are also excluded, i.e. Hungarian citizens (or ethnic Hungarians) born in any other country or Hungarian children born in the UK. These data therefore represent mainly the ‘first generation.’ Also, they only count the ‘usually resident population’ defined by the ONS as people ‘who had been resident or intended to be resident in the UK for a period of 12 months or more’ (Office for National Statistics). Therefore, numbers may include some of those who arrived during the 12-month period before 27 March 2011 (census day), while excluding others. ‘National Insurance Number Allocations to Adult Overseas Nationals Entering the UK’ after the census reflects country of citizenship, and thus includes those born outside Hungary, but not the children. Its major drawbacks are that it only registers ‘labour migrants’ and does not record out-flows. I have tried to deal with the challenge posed by this latter shortcoming as outlined below (see Table 1), and I believe the present estimate to reflect ‘usually resident’ Hungarians in keeping with the above definition.
7 The latest available APS dataset for December 2012 estimates the number of Hungarians at 49 000 (+/– 10 000). My calculation for the same date results in 61 618 estimated ‘usually resident’ Hungarian migrants. For an assessment of the different available migration data sources, see e.g. Drinkwater and Garapich (2011), Boden and Rees (2010).
8 While the two statistics do not necessarily cover the same population, it is not unreasonable to assume a high level of agreement, and I shall treat them as coterminous.
9 Jivraj, Simpson and Marquis (2012) have discovered a similar trend for A8 migrants based on school census data; also cf. Bauere et al. (2007); Simpson, Finney (2009); Trevena, McGhee, Heath (2013).
10 For more details on the Standard Occupational Classification (SOC 2000), see the Higher Education Statistics Agency: https://www.hesa.ac.uk/index.php?option=com_content&view=article&id=102&... (accessed: 16 December 2014).
11 Romanian and Bulgarian nationals who joined the EU in 2007 did not have free access to the British labour market until January 2014, self-employment being for them the primary form of economic activity they could undertake.
12 During the fieldwork a total of 27 interviews were conducted with Hungarian speakers, of which 17 were Hungarian citizens with a previous Hungarian address. Data in this paper are from these 17 interviews. Initial research participants in the overall project were selected based on a purposeful random sampling procedure, mainly from social media communities (6 participants), followed by chain-referral sampling (21 participants).
13 The Leave/Stay survey was administered by researchers at the Hungarian Academy of Sciences (MTA) during May 2014, complementing a documentary film series on migrants’ experiences (http://www.menjekmaradjak.hu/english/, accessed: 16 December 2014). Preliminary results have been disseminated in press releases.
14 Factors given the two highest values on a scale of one to ten.
15 Interviews were conducted in Hungarian and translated by the author. I use pseudonyms throughout the paper to safeguard the anonymity of the participants.
16 Law No. CCIV. of 2011 on national higher education, Ch.12, Section 28/A, §48/A stipulates that (partially) state-funded students will have to hold employment in Hungary for a period commensurate to the length of their funded studies during the twenty years following their graduation, otherwise – including if they fail to graduate in timely fashion – they must reimburse the amount of their scholarships.
References
Anderson B., Ruhs M., Rogaly B., Spencer S. (2006). Fair Enough? Central and East European Migrants in Low-Wage Employment in the UK. York: Joseph Rowntree Foudation. Online: www.compas.ox.ac.uk/changingstatus (accessed: 15 November 2011).
Åslund A. (2010). The Last Shall Be the First: The East European Financial Crisis. Washington: Peterson Institute.
Bahna M. (2008). Predictions of Migration from the New Member States after Their Accession into the European Union: Successes and Failures. International Migration Review 42(4): 844–860.
Bauere V., Densham P., Millar J., Salt J. (2007). Migrants from Central and Eastern Europe: Local Geographies. Population Trends (129): 7–19.
Black R. (ed.) (2010). A Continent Moving West? EU Enlargement and Labour Migration from Central and Eastern Europe. Amsterdam: Amsterdam University Press.
Blaskó Z., Jamalia N. (2014). Surveying Emigration I. Report on the First Stage of the Seemig Pilot Study in Hungary and Serbia. Research report developed within the project ‘SEEMIG Managing Migration and Its Effects – Transnational Actions Towards Evidence Based Strategies.’ Online: http://www.seemig.eu/downloads/outputs/SEEMIGPilotReport1.pdf (accessed: 16 December 2014).
Boden P., Rees P. (2010). Using Administrative Data to Improve the Estimation of Immigration to Local Areas in England. Journal of the Royal Statistical Society 173(4): 707–731.
Castles S., Miller M. J. (2009). The Age of Migration: International Population Movements in the Modern World. Basingstoke, N. Y.: Palgrave Macmillan.
Drinkwater S., Garapich M. (2011). Using Survey Data to Identify Migration Patterns. WISERD Methods Briefing Series. Cardiff: Wales Institute of Social and Economic Research, Data and Methods.
Dustmann C., Fabbri F. (2003). Language Proficiency and Labour Market Performance of Immigrants in the UK. The Economic Journal 113(489): 695–717.
Eade J., Drinkwater S., Garapich M. (2007). Class and Ethnicity – Polish Migrants in London. Research Report for the RES-000-22-1294 ESRC project. Swindon: ESRC.
Engbersen G., Snel E., de Boom J. D. (2010). ‘A Van Full of Poles’: Liquid Migration from Central and Eastern Europe, in: R. Black (ed.), A Continent Moving West? EU Enlargement and Labour Migration from Central and Eastern Europe, pp. 115–140. Amsterdam: Amsterdam University Press.
European Commission (2012). Special Eurobarometer 386: Europeans and Their Languages. June 2012. Brussels: European Commission. Online: http://ec.europa.eu/public_opinion/archives/ebs/ebs_386_en.pdf (accessed: 16 December 2014).
European Commission (2013a). Standard Eurobarometer 80: European Citizenship. Autumn 2013. Brussels: European Commission. Online: http://ec.europa.eu/public_opinion/archives/eb/eb80/eb80_en.htm (accessed: 16 December 2014).
European Commission (2013b). Standard Eurobarometer 80: Public Opinion in the European Union. Autumn 2013. Brussels: European Commission. Online: http://ec.europa.eu/public_opinion/archives/eb/eb80/eb80_en.htm (accessed: 16 December 2014).
Favell A. (2008). The New Face of East–West Migration in Europe. Journal of Ethnic and Migration Studies 34(5): 701–716.
Favell A., Nebe T. M. (2009). Internal and External Movers: East–West Migration and the Impact of EU Enlargement, in: E. Recchi, A. Favell (eds), Pioneers of European Integration: Citizenship and Mobility in the EU, pp. 205–224. Cheltenham: Edward Elgar.
Fox J. E., Morosanu L., Szilassy E. (2012). The Racialization of the New European Migration to the UK. Sociology 46(4): 680–695.
Freedom House (2012). Freedom of the Press 2012: Hungary. Online: http://www.freedomhouse.org/report/freedom-press/2012/hungary#.VFU-QvmsWuI (accessed: 27 October 2014).
Garapich M. P. (2008). The Migration Industry and Civil Society: Polish Immigrants in the United Kingdom before and after EU Enlargement. Journal of Ethnic and Migration Studies 34(5): 735–752.
Gödri I., Feleky G. A. (2013). Elvándorló Fiatalok? Migrációs Tervek a Magyarországi 18–40 Évesek Körében. Online: http://www.demografia.hu/index.php/kiadvanyok/korfa (accessed: 30 July 2014).
Granovetter M. S. (1973). The Strength of Weak Ties. American Journal of Sociology 78(6): 1360–1380.
INSEE (Institut National de la Statistique et des Études Économiques) (2008). Population Immigrée, Population Étrangère en 2008. Online: http://www.insee.fr/fr/themes/detail.asp?reg_id=0&ref_id=pop-immigree-po... (accessed: 30 July 2014).
INSEE (Institut National de la Statistique et des Études Économiques) (2011). Base de Tableaux Détaillés: Nationalité et Immigration en 2011. Online: http://www.insee.fr/fr/themes/detail.asp?reg_id=99&ref_id=td-nationalite-11 (accessed: 30 July 2014).
Jivraj S., Simpson L., Marquis N. (2012). Local Distribution and Subsequent Mobility of Immigrants Measured from the School Census in England. Environment and Planning A 44(2): 491–505.
Johnston R., Khattab N., Manley D. (2014). East Versus West? Over-Qualification and Earnings among the UK’s European Migrants. Journal of Ethnic and Migration Studies, July 21, 2014, doi: 10.1080/1369183X.2014.935308.
Kapitány B., Rohr A. (2013). A Magyarországon Állandó Lakcímmel Rendelkező 18–49 Éves Magyar Állampolgárok Mintegy 7,4 Százaléka Tartózkodik Jelenleg Tartósan Külföldön. Online: http://www.demografia.hu/index.php/kiadvanyok/korfa (accessed: 30 July 2014).
KSH (Központi Statisztikai Hivatal) (2014). Magyarország, 2013. Budapest: Központi Statisztikai Hivatal.
Kupiszewski M. (2002). How Trustworthy are Forecasts of International Migration between Poland and the European Union? Journal of Ethnic and Migration Studies 28(4): 627–645.
Lados G., Hegedűs G. (2012). A Re-Migráció Európai és Hazai Lehetőségeinek Értékelése a Munkaerőpiac Szempontjából, in: D. Nyári (ed.), Vi. Magyar Földrajzi Konferencia, pp. 509–523. Szeged: University of Szeged.
Makó Á., Tóth I. J. (2014). Hol Szeretnék Továbbtanulni? Harminc Magyarországi Állami Gimnáziumban Tanulók Körében Végzett Adatfelvétel Eredményei. Budapest: MKIK Gazdaság- és Vállalkozáskutató Intézet. Online: http://gvi.hu/index.php/hu/research/showItem.html?id=403 (accessed: 16 December 2014).
McCollum D., Findlay A. (2011). Trends in A8 Migration to the UK During the Recession. Population Trends 145. London: Office for National Statistics. Online: http://www.ons.gov.uk/ons/rel/population-trends-rd/population-trends/no-... (accessed: 16 December 2014).
McDowell L. (2008). Old and New European Economic Migrants: Whiteness and Managed Migration Policies. Journal of Ethnic and Migration Studies 35(1): 19–36.
MNB (Magyar Nemzeti Bank) (2014a). A Háztartási Szektor Részére Nyújtott Hitelállomány Összetétele. Online: http://www.mnb.hu/Statisztika/statisztikai-adatok-informaciok/adatok-ido... (accessed: 30 July 2014).
MNB (Magyar Nemzeti Bank) (2014b). Report on Inflation (March 2014). Charts and Data Series Chapter III. Online: http://www.mnb.hu/Kiadvanyok/mnbhu_inflacio_hu/mnbhu-inflaciosjelentes-2... (accessed: 30 July 2014).
MTA (Magyar Tudományos Akadémia) (2014). Menjek vagy Maradjak? Figyelő Online, 5 June. Online: http://figyelo.hu/cikkek/404903-menjek-vagy-maradjak (accessed: 16 December 2014).
Parutis V. (2014). ‘Economic Migrants’ or ‘Middling Transnationals’? East European Migrants’ Experiences of Work in the UK. International Migration 52(1): 36–55.
Portes J., French S. (2005). The Impact of Free Movement of Workers from Central and Eastern Europe on the UK Labour Market: Early Evidence. Working Paper 18. Leeds: Department for Work and Pensions.
Recchi E., Favell A. (eds) (2009). Pioneers of European Integration: Citizenship and Mobility in the EU. Cheltenham: Edward Elgar.
Rona–Tas A., Guseva A. (2013). Information and Consumer Credit in Central and Eastern Europe. Journal of Comparative Economics 41(2): 420–435.
Sassen S. (1988). The Mobility of Labor and Capital: A Study in International Investment and Labor Flow. Cambridge: Cambridge University Press.
Simpson L., Finney N. (2009). Spatial Patterns of Internal Migration: Evidence for Ethnic Groups in Britain. Population, Space and Place 15(1): 37–56.
Szoke L. (1992). Hungarian Perspectives on Emigration and Immigration in the New European Architecture. International Migration Review 26(2): 305–323.
Trevena P., McGhee D., Heath S. (2013). Location, Location? A Critical Examination of Patterns and Determinants of Internal Mobility among Post-Accession Polish Migrants in the UK. Population, Space and Place 19(6): 671–687.